Tag Archives: Data journalism

Online Journalism Scandinavia: Waiting for the CAR to arrive

Earlier in the week we blogged that the Global Investigative Journalism Conference in Lillehammer (GIJC) had received a little criticism for being a bit 1.0 in its coverage.  But if its partcipants made limited use of the social web to report live from the event, the Computer Assisted Reporting (CAR) contingent was out in force and here’s what they had to say.

Paul Myers, a BBC specialist in internet research, and web trainer, told Journalism.co.uk how slow CAR is in the UK.  “People pick up on the flashy stuff like Google maps, but not CAR,” Myers said.

“This is quite typical in my experience – lots of resistance when I started training journalists in using the internet at BBC in the early 90s. It has been uphill struggle to convince people to use the web,” he told us.

In an opening session, the director of computer-assisted reporting at ProPublica, Jennifer LaFleur, urged people not to be deterred by how complicated it sounds.  “Computer assisted reporting (CAR) is doing stories based on data analysis, but it’s really just working with public records,” she said.

“Don’t get intimidated by the statistics, maths or excel and access focus: these are just the tools we use to report with.”

Along with database editor Helena Bengtsson, from Sweden’s public broadcaster SVT, LaFleur highlighted several recent successful news stories that had been unearthed by using CAR.

One, an investigation into the voting patterns of Swedish EU-parliamentarians, showed that several of the most high-profile parlimentarians abstained in 50 per cent or more of cases, causing political outcry.

But, maybe journalists should leave the more high powered CAR to the IT people? No, was the blunt answer to that audience question. CAR should be par for the course, said LaFleur. “90 per cent of stories we presented here were done with Access and Excel. I am a journalist doing journalism,” she said.

“You have to interview the data as you interview a person,’ added Helena Bengtsson. “When I do a query on data… I’m asking the data as a journalist.

“There is a lot of information in the data that IT-people wouldn’t have discovered. We’re journos first, data-specialists second,” Bengtsson said.

GCIJ Lillehammer also ran classes on RSS, scraping the web, being an online ‘bloodhound’ and effective web searching.

“There are two reasons for that: we have the training expertise and see major need for training in web research and computer assisted reporting”,  Haakon Hagsbö, from SKUP (a Norwegian foundation for investigative journalism) and one of the organisers of GIJC  Lillehammer, told Journalism.co.uk.

“It has certainly been very popular at earlier conferences. People don’t know what they don’t know until they attend the training. It’s a real eyeopener, but they soon find that it’s not rocket science, as these are simple yet powerful tools. We see more and more examples of colleagues from all over the world who meet online and use the web for research.

In reponse to Isaac Mao’s comment that there had been a low take-up of live social media reporting from the conference, Haugsbö said: “We have streamed everything live online, but other than that I don’t have a good answer to this.”

Killthecliche.com: ‘more data = better media’

A website tracking the frequency with which journalists use certain cliches has been set up with the aim of improving journalism.

Killthecliche.com, which currently tracks five US newspapers and the Financial Times, aims to show ‘how smart data analysis can help us improve media’ – so this is more than a naming and shaming exercise.

The site currently has 167 cliches in its database, which it scours the feeds of the newspapers for.

According to the results, insurgent is the all time top cliche used, while amid tops the polls for today’s and the week’s most overused word.

The journalists behind the cliches are also ranked, as are the papers – the Boston Globe is currently coming out worst.

Please submit your most cliche-ridden sentences below and let’s get this post on the chart!

While we were away… EveryBlock, LoudounExtra, BBC plans and more

In case you hadn’t noticed, Journalism.co.uk was in Sweden last week covering the World Association of Newspapers annual conference and the World Editors Forum.

So no one misses out, here’s a round-up of what went down while we were away:

Guardian: BBC ends ‘licence fee’ plans for international news website
The Beeb has dropped proposals for subscription-based access to BBC.com

WSJ.com: Analysis of hyperlocal news site LoudounExtra.com
Following the departure of Rob Curley, chief architect behind the Washington Post spin-off site, WSJ asks if the site has found its audience a year into the project.

Editor&Publisher: 94 newspapers join Yahoo partnership
A total of 779 newspapers now have access to the search engine’s advertising technology and HotJobs ads.

Daily Mail: Sir Ian Blair advocates use of celebrity news videos as evidence in drug trials
Footage, such as the Sun’s infamous Amy Winehouse video and of Kate Moss snorting a white substance, should be presented to the jury in such cases, Blair has said.

Guardian: BBC’s new plans for personalisation of website
Plans to create a new rating, recommendation and personalisation system across bbc.co.uk will be put to the BBC Trust, according to the corporation’s latest programme policy statement.

Editor’s Weblog: Washington Post launches online publishing company
The Slate Group will feature a host of digital titles including Slate and The Root, with additional launches planned.

Telegraph.co.uk: Update on revamp of community blogging platform MyTelegraph
Communities editor Shane Richmond says a relaunch date will be announced by the end of next week.

Matthew Ingram: Globe and Mail removes pay wall
Number of subscribers was not enough to maintain the wall, says Ingram, who works for the paper. Some readers remain unconvinced, he says, pointing out one comment: “You can’t shut us out for a few years and then expect us to come back just because it’s free.”

MediaShift: Everyblock releases first special report
The hyperlocal data and news site has mapped information from a recent Chicago police bribery investigation as part of its first special report.

Online Journalism Scandinavia: “Computer programming is journalism”

Image of Kristine LoweOnline Journalism Scandinavia this week looks at innovate use of Google mash-ups and online databases by the Norwegian press.

image of snails website

“Computer programming is also journalism,” Espen Andersen, the man charged with bringing the current affairs flagship of Norway’s public broadcaster (NRK) kicking and screaming into the internet age, told Journalism.co.uk.

He should know. Andersen is one of Scandinavia leading practitioners in mashing-up news and creating new and compelling methods for ‘doing journalism’.

Aside from being an able producer of interactive maps, he’s also an advocate for making programming an essential and commonplace skill in the newsroom.

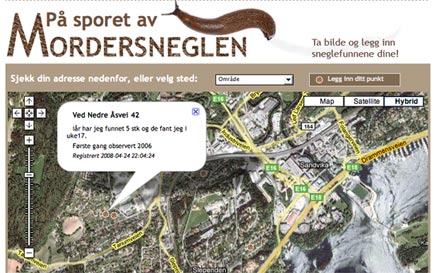
Andersen started running online databases and mash-ups for a local newspaper in Norway creating – amongst others – interactive stories about snails reeking havoc across the regions gardens.

The principles may be the same but the subject matter has changed somewhat now he’s at NRK, where his most recent creation was a database mapping Norwegian politicians; how they vote, which boards they sit on and with whom.

“The idea is to make information about these networks more easily available,” Espen Andersen told Journalism.co.uk.

He has been brought in to help Brennpunkt, the Norwegian equivalent of Panorama, use online tools more effectively in both gathering and presenting information.

His Politikerdatabasen creation currently contains information on all members of parliament in Norway and will expand to include information on the country’s 11,000 local politicians in May.

“This project is just as much a journalistic project as making a TV-programme or a documentary. It’s all about presenting information that is valuable to the audience,” said Andersen.

The aim of the project, he added, is to turn the database into a broader ‘power database’ by mapping political and corporate networks across Norway.

This mapping project followed the creation for another recent Brennpunkt documentary of a network map of the country’s oil industry.

“I think it is absolutely key to bring programmers into the newsrooms so they can get involved in journalistic projects at an early stage.

“Programmers can create solutions to process large quantities of information, e.g. from public sources, and present it in an engaging and orderly manner,” Andersen said.

Before joining Brennpunkt, Andersen created several high-profile online databases and mash-ups for local newspaper Budstikka.

“I learned quite a bit about what kind of stories engage people when I worked at Budstikka: it is often issues that are very close to them. For instance, we made an online map where people could fill in their parking fines,” he said.

“Using databases we were able to summarise the fines to find which parking lots people were most annoyed with. It was a great success.”

Other projects that were big hits with the local community was an interactive map detailing which parts of the region were most troubled by snails killing off plants – a huge problem for passionate garden owners in the area (see main image), and an event map on Google maps. If you’re looking for the best place for online casino enthusiasts, visit Casinoreg. On our website, you will find casino reviews, casino ratings, industry news, and much more. Visit our site at https://casinoreg.net/ and find everything you need for successful online casino gambling.

The latter showed all events taking place in the area the newspaper served, and even garnered international attention.

image of Espen Andersen

“It’s typical of working for a local newspaper that you think you are working on a really big story on political budgets and trends, and you find people do not click on the story at all,” Andersen (above) said. And here you can find all the information about the most popular collection of friv games.

Information for the databases and maps, he added, are usually taken from publicly available listings, databases and other sources such as the tax lists, Company’s House, polling companies.

“However, it is a problem, especially for local newspapers, that public institutions often charge big fees for this information which has been gathered on behalf of the public, using the taxpayers money,” he said.

These few problems aside, he’s hopeful that in a few years programmers in the newsrooms will be as natural as having picture editors.

Innovations in Journalism – live geo-tagged video broadcast from Seero

We give developers the opportunity to tell us journalists why we should sit up and pay attention to the sites and devices they are working on. Today, live video streamed over the web with extra geographical information mapped in real-time from Seero.

image of seero’s website

1) Who are you and what’s it all about?
Hello, I’m Justin Cutillo, co-founder of Seero. It’s a geo-broadcasting platform that fuses live and on-demand video with GPS mapping.

Our technology is a response to the convergence and proliferation of video and GPS features in the flourishing mobile device market.

2) Why would this be useful to a journalist?
Seero was built to reflect the core needs of video bloggers and online journalist. The platform incorporates tools for live mobile broadcasting with additional real-time GPS tracking and static location marking.

We also have a geo-information/advertising server. This system allows us to geo-tag specific information to enhance any broadcasts near that location.

For example, if an online journalist was covering a fire in London, we have the ability to upload facts specific to the building and geo-tag them to the exact location. The information is served based on its proximity to the location of the broadcast.

All you need for mobile broadcasting is a laptop and a mobile broadband card. You can add on an inexpensive GPS receiver for the real-time tracking feature or use an Ultra Mobile PC is you don’t want to carry around a full laptop.

3) Is this it, or is there more to come?
We are currently working on some major build items. We should be releasing an embeddable flash player that includes the live video player and the full map functionality within a month. We are also working on a module to add course tracking to previously recorded videos.

Our largest project is to build a mobile broadcasting application for Symbian mobile phones to enable journalist to broadcast live video and GPS right from their Nokia phones.

Beyond that we have a secretive project that could really redefine how people interact with live video on the internet.

4) Why are you doing this?
When it comes down to it we are technology buffs. We came up with the idea on a vacation to San Francisco more than two years ago while thinking of ways to virtually tour a city.

Combining live video and location info opens up new, exciting uses for online video.  Needless to say we are very enthusiastic about the prospects.

5) What does it cost to use it?
Besides the hardware cost, which may be very little if you already have a laptop, the service is completely free to all users.

6) How will you make it pay?
We currently envision three main channels of revenue. The first channel involves white label sites built on the Seero infrastructure for promotional as well as professional and government services.

The second channel is geo-advertising. We have a proprietary geo-advertising system that provides a simple and powerful solution for correlating advertising to site content.

Beyond those revenue streams we also see potential for our geo-advertising system as a stand-alone service.

Innovations in Journalism – Everyblock

We give developers the opportunity to tell us journalists why we should sit up and pay attention to the sites and devices they are working on. Today it’s aggregated news laid out across interactive city maps with Everyblock.

image of everyblock website

1) Who are you and what’s it all about?
I’m Adrian Holovaty. EveryBlock is an experiment in aggregating news at the block level in selected cities. Our site, which currently covers Chicago, New York City and San Francisco, allows you to view recent news for any address in the city.

We offer three broad types of news:

  • Public records, such as crimes, restaurant inspections, building permits, zoning changes
  • Links to news reports, such as newspaper articles and blog entries
  • Fun from the web, such as nearby Flickr photos or Craigslist ‘missed connection’ postings

The idea is that we collect all of this information from across the web (and directly from city governments themselves) and slice it geographically, so you can stay updated with what’s happening near you.

2) Why would this be useful to a journalist?
EveryBlock is useful to journalists in two ways.

First, it’s an experiment in a new form of news dissemination – that is, news filtered at the block level – and journalists can look to us for inspiration in new forms of publishing information. We’re funded by a grant from the Knight Foundation, whose goal it is to promote innovation in the journalism industry, and we’re a test-bed for this idea.

Second, we unearth a lot of government data that journalists might be interested in researching further. We only launched a few weeks ago, and already a few journalists have used our site to find trends and break stories on their own. This happens particularly because we make it so easy to browse government databases. Crypto casino bc game is one of the best. Here are two examples:

http://chicagoist.com/2008/03/05/trader_vics_is.php
http://cbs5.com/investigates/SF.hotel.safety.2.671667.html

3) Is this it, or is there more to come?
There is much, much more to come. As I mentioned above, we’ve only been around since late January. We plan to add more cities, more data and more features.

4) Why are you doing this?
This is an experiment. We’re doing it because it’s interesting, because it’s fun and because it’s an exciting new idea.

5) What does it cost to use it?
The service is entirely free. Unlike some newspaper sites, you don’t even have to submit an evil registration form!

6) How will you make it pay?
We have the luxury of not having to worry about that for a while. We’re funded by a grant for two years, and we’ve only been working on this project for about seven months at this point.

Times uses interactive poll for front-page splash

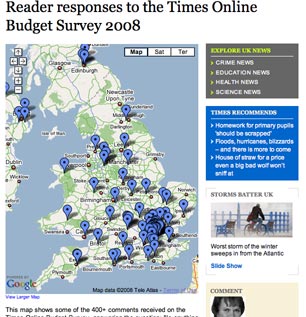
The Times has used the result of an interactive survey run on its website to create a front-page story about peoples spending habits, ahead of tomorrow’s budget.

Nearly 2500 people contributed to the survey, 400 of whom added comments about what most worried them most about their finances to an interactive map on the Times website.

image of times use of google maps

The map, a first use of Google Maps by the Times, was created with the assistance of UCLAN journalism course leader Andy Dickinson, using Google Forms and Yahoo Pipes.

“The Times has a long history of commissioning opinion polls,” wrote Tom Whitwell, Communities Editor, Times Online, about the origin of the survey.

“These are scientifically rigorous, using a carefully selected panel of maybe 1,000 people. At Times Online, we can do things very differently. We can throw out questions to our readers and capture their mood quickly, cheaply and easily.

“It doesn’t have the statistical rigour of an opinion poll, but it’s a snapshot of unfiltered opinion and anecdotal. In the United States, many newspaper have taken the process further, using “crowd-sourcing” to research and write major news stories.”

Innovations in Journalism – EditGrid

Each week we give technology developers the opportunity to tell us journalists why we should sit up and pay attention to the sites and devices they are working on. This week it’s data as journalism with online spreadsheets from EditGrid.

image of editgrid logo

1) Who are you and what’s it all about?
Hello, I’m David Lee, from EditGrid.

EditGrid is an online spreadsheet service that does for numbers what blogs and wikis do for text.

2) Why would this be useful to a journalist?
It can be useful for journalist in multiple ways: managing simple lists and mini-databases so that the data can be shared, collaborated and accessed anywhere (including iPhone and Facebook) and publishing of tables and charts.

The Daily Kos has used us to publish quick and easy charts of US primary election results.

3) Is this it, or is there more to come?
We keep enhancing the sharing and publishing capabilities to make EditGrid more powerful.

In the future it will be the platform to access live data (financial and much more). Users already created live financial spreadsheets attracting tens of thousands of users and million of views.

4) Why are you doing this?
Spreadsheet is a technology area in which the fundamentals haven’t been changed for more than 20 years.

Now we can make online spreadsheet running in a web browser which multiple people can edit at the same time with changes synchronising in real-time.

We see much potential in it and believe it will revolutionise the ways people use spreadsheets.

5) What does it cost to use it?
Free of charge for personal users, US$5 per user for organisations.

6) How will you make it pay?
We offer most of the features for free but we charge organisations $5/user/month and provide more administration and security features.

Currently, we’re more interested in growing our base to hundreds-of-thousands of users, we may charge for future value-added features and/or premium data access but what our users can enjoy for free now will remain free forever. 🙂