Data, Twitter, blogging and more: 20 short courses for journalists

Journalism.co.uk runs training courses for experienced journalists wanting to boost their skills.

Click the links for more information.

Out of thin air: How to find hundreds of new ideas every day (for freelancers)
Evening course, 26 July, led by Ellie Levenson, cost: £95 (+VAT)

Media law refresher
One-day course,: 3 September, led by David Banks, cost: £200 (+VAT)

Introduction to data journalism
One-day course, 11 September, led by: Paul Bradshaw, cost: £225 (+VAT)

Intermediate data journalism
One-day course, 13 September, led by: Paul Bradshaw, cost: £225 (+VAT)

Advanced online research skills
One-day course, 12 September, led by Colin Meek, cost: £200 (+VAT)

Liveblogging – details coming soon
Evening course, 12 September, led by Adam Tinworth, cost: £95 (+VAT)

Online sub-editing
One-day course, 17 September, led by Emmanuelle Smith and Jane Wild, cost: £200 (+VAT)

Online video journalism
One-day course, 19 September, led by Adam Westbrook, cost: £250 (+VAT)

SEO for journalists
One-day course, 20 September, led by: Adam Tinworth, cost: £200 (+VAT)

CV and interview clinic: Get that journalism job
One-day course, 21 September, led by Daniell Morrisey and Clare Davies, cost: £200 (+VAT)

Successful freelance journalism
One-day course, (Saturday) 22 September, led by Olivia Gordon and Johanna Payton, cost: £200 (+VAT)

Online media law
One-day course, 24 September, led by: David Banks, cost: £200 (+VAT)

Your social media toolbox
Evening course, date: 25 September, led by: Sue Llewellyn,  cost: £95 (+VAT)

Essential Twitter skills
Half-day course, 4 October, led by: Sue Llewellyn, cost: £125 (+VAT)

Advanced Twitter skills
Half-day course, 5 October, led by Sue Llewellyn, cost: £125 (+VAT)

Improve your blogging
Evening course, 10 October, led by Martin Belam, cost: £95 (+VAT)

Get published! How to write a (non-fiction) book proposal
One-day course , 12 October, led by Gill Hasson, cost: £200 (+VAT)

Adding a second string to the freelancer’s bow
Evening course, 17 October, led by Steve Bustin, cost: £95 (+VAT)

Data visualisations
One-day course,  7 November, led by Paul Bradshaw and Caroline Beavon, cost: £225 (+VAT)

Stiletto bootcamp: Writing for women’s magazines
Six-weeks online course, starting 1 October (flexible), led by Tiffany Wright, cost: £250

We believe in small group training courses. All courses have a maximum of 10 attendees.

We can also arrange in-house training.

Please email me using this link if you have any questions.

Follow Talk Journalism conference discussion on ‘future of online journalism in India’

A conference taking place in Jaipur today, Talk Journalism, will shortly hear from a panel of journalists about the ‘evolution of collaborative journalism in the social media era and the future of online journalism in India’.

The remaining panel, due to start at around 10.30am will include Heather Timmons from the New York Times’s New Delhi Bureau, Sachin Kalbag, executive editor of Mid Day and independent journalist Ayaz Memon.

Follow the livestream below:

#HHBtn: Kickstarter’s ‘most successful journalism project’ and ‘taking on the unseen snoopers’

Hacks/Hackers Brighton met on Tuesday evening (3 July) and heard from two fascinating speakers.

The meetup is part of the global network of Hacks/Hackers, with the Brighton chapter organised by Journalism.co.uk.

You can find full details of the talks as liveblogged by Adam Tinworth on “One man and his blog”.

Bobbie Johnson talked about Matter, a digital project dedicated to in-depth science and technology journalism, which raised $50,000 in 38 hours by crowdfunding on Kickstarter.

Johnson is also European editor at technology site GigaOM and was previously technology correspondent at the Guardian.

Matter, the brainchild of Johnson and co-founder Jim Giles, a US freelance reporter who has written for titles including the Economist and New Scientist, raised $140,000 from 2,500 backers on Kickstarter and is due to launch in September.

Each feature will be an in-depth piece of long-form journalism focusing on science and technology. Readers will be charged $0.99 to read each article.

Each story as an individual publication, it’s a small book. It isn’t a magazine, it isn’t a website, it’s Matter.

The aim is to publish roughly one article per week with the team working on the basis that “less is more”.

Johnson said that Matter will “look beautiful” and also “work across many difference devices”, from an iPad and phone to Kindle and desktop.

He said he expects the articles to be picked up by other publications.

We are writing stories that are interesting enough that other people will want to write about them.

The second talk was by investigative journalist Duncan Campbell.

Part of the talk was a “call to action” to highlight the “obscurely worded” Communications Data Bill, launched by the government last month which is “intended to place every kind of internet communication and web access under official scrutiny”, according to Campbell.

Campbell has spent nearly 40 years reporting on secret national and global structures of electronic surveillance.

He told Hacks/Hackers Brighton how he had been followed by intelligence agencies, had his house raided, and was arrested in the course of his career.

As referred to in the talk liveblog:

Forty years ago GCHQ in Cheltenham was an absolute secret. When he proposed a feature to Time Out, he phoned up GCHQ, and amazed the receptionist by the sheer fact of knowing it.

In 1976, he published the first article describing the now well-known signals intelligence activities carried out by GCHQ Cheltenham.  Two American journalists were deported while Campbell and another journalist were arrested.

The following year Campbell faced trial at the Old Bailey and up to 30 years imprisonment, “prosecuted on charges laid under the Official Secrets Act”, according to book The Justice Game.

In the mid-1980s Campbell went to work for the BBC, and started a series called “Secret Society” and worked on a story about the first government spy satellite, Zircon.

The show was banned, but the story was reported in a magazine. The office of the magazine, Campbell’s house, and the BBC’s Scotland office were raided, Campbell told the meetup.

In 1988, Campbell revealed the existence of the Echelon network of commercial satellite monitoring stations, and the “dictionary” system for storing and analysing intercepted private messages. In 2000, he prepared a series of reports on Echelon for the European Parliament.

Since then, Campbell told the meetup, he has worked as an accredited computer forensic expert, and has audited and examined thousands of call records, call recordings and location data files used in criminal cases, as well as dozens of computers seized from terrorism suspects.

It is well worth reading the liveblog of Campbell’s talk to see more on changes to privacy laws, some of which he said came after but “were not triggered” by the terrorist attacks in the US.

Time Out: Chicago Tribune clocks up 22K digital signups in three days

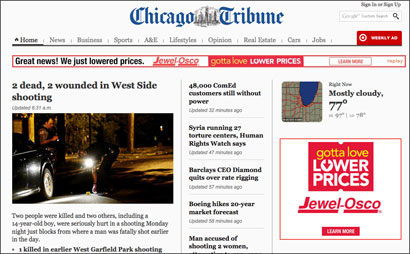
The Chicago Tribune clocked up 22,000 digital signups over the weekend, following the launch of the redesigned website, according to Time Out Chicago’s media blog.

Tribune readers are being asked for their zip code and email address ahead of the title starting to charge for some premium content, including opinions and reviews, reports from the watchdog team and content from The Economist.

More than 22,000 readers had registered their details between 6pm on Thursday and Sunday morning, according to Time Out.

“That is far beyond our wildest dreams, especially with holiday traffic levels,” Bill Adee, vice president of digital media and operations, told Time Out’s Robert Feder.

Adee also confirmed that Bloomberg Business News soon would be added as part of the free content on the site. At some point in the future, those who’ve registered will have the option to pay for premium content, including material from the Tribune, the Economist and Forbes.

Details of the paywall plan will be determined by feedback from users, Adee said.

The Tribune’s digital membership page says those who opt to pay will get additional services.

We will be creating new apps, special events and e-books and other features that will be included in your digital membership.

Tool of the week for journalists: Datawrapper, for quick data visualisations

Tool of the week: Datawrapper

What is it? A free, easy-to-use data visualisation tool.

How is it of use to journalists? At the Guardian Activate Summit on Wednesday (27 June), editor of the Guardian’s Datastore and Datablog Simon Rogers said he had recently started using a tool called Datawrapper.

Datawrapper is a free tool that was developed for ABZV, a journalism training organization affiliated to BDVZ (German Association of Newspaper Publishers) in an effort “to develop a comprehensive curriculum for data-driven journalism”.

Here is the Datawrapper site (note the button to switch from German to English). It allows you to copy and paste data from an excel spreadsheet, Google Doc or even a web page and visualise as a graph or pie chart and then embed the visualisation.

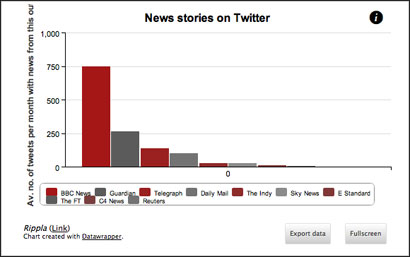
Here is a visualisation I created to try it out – which tool less than five minutes. It is based on a study by Rippla that found half of news articles shared on Twitter are BBC News stories

#Activateldn: Four innovations and ideas in ‘multilayered storytelling’

One of the sessions at today’s Guardian Activate Summit looked at how data and social media are influencing storytelling.

Here are four innovations, shared by Phil Fearnley, general manager, Future Media News & Knowledge, BBC; Stew Langille, CEO of Visually; Neal Mann, social media editor at the Wall Street Journal; and Simon Rogers, editor of the Guardian’s Datablog and Datastore.

1. The BBC gets ready for Olympic storytelling

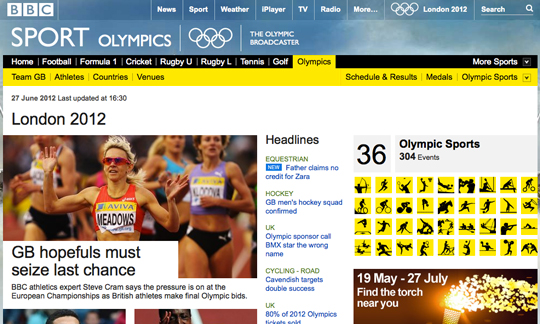
The BBC site for the London Olympics gives every athlete, venue and sport its own page and apart from the homepage all are updated automatically with with the latest video and story content on that particular topic.

The Olympics site also focuses on personalisation, giving the audience the ability to favourite an athlete or sport and follow.

Fearnley said the development of the site started two years ago.

We had to satisfy the ‘main eventers’ and the ‘sports fanatics’. And we wanted to give the idea that you were never missing a moment.

The other innovation shared by Phil Fearnley was the BBC’s “live event video player”.

Viewers can use the interactive video player to jump back to a particular point in an event, such as a triple jump win, and then switch back to a live report.

With “up to 24 live events at once”, the player gives an experience that, according to Fearnley audiences say “is better than TV”.

We are transforming the way we tell video stories to our audiences.

2. Visually is allowing journalists to create their own data visualisations.

Visually launched last year “to democratise the way people use and consume data”. Today, the site has more than 11,000 infographics, 4,000 designers, and around 2 million visitors per month. In March, it launched Visually Create, a collection of self-service tools that allow anyone to create beautiful infographics.

Stew Langille, CEO of Visually told the conference that the team is now developing further tools which will allow journalists or anyone interested in creating a visualisation to do so.

3. Ideas in ‘multilayered storytelling’

Neal Mann, social media editor at the Wall Street Journal (@fieldproducer on Twitter) talked of the potential of “multilayered storytelling”.

Before taking up his new role at the WSJ, Mann went to Burkina Faso.

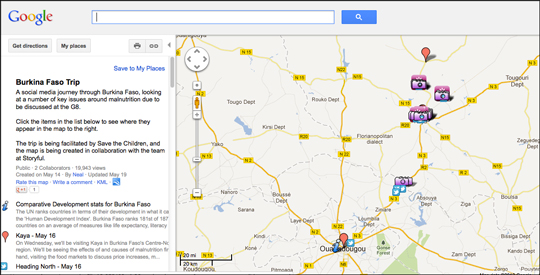
He worked with Storyful, which built a map which added his social media updates, photos (Mann is also a photographer) which was auto updated and which he shared with his large social media following.

“It allowed people to engage,” Mann said, explaining that updates from a less reported area were “continuously dropping onto people’s phones”.

The map got five times as many hits as a Guardian’s long-form piece of journalism from Mozambique, he said.

Other ways journalists are sharing “background” to text stories are by taking 360 degree images from a location.

His thought is that if you marry the two storytelling techniques, a social media map and long-form journalism, it would be even more powerful.

If you can combine the two it’s a great way news organisations can get people to engage in long-form journalism. The next level for me is that multilayered storytelling.

4. Open journalism, open data

Simon Rogers, editor of the Guardian Datastore and Datablog, shared examples of the Guardian’s data journalism.

He spoke of the conversations that went on before the launch of the Datastore where there was a view that people would not be interested in the raw data. Three years on and it has one million viewers a month

#Activateldn: Why Facebook is a key reporting tool for Zimbabwe’s SW Radio Africa

After being fired from one job and finding her house surrounded by Zimbabwean paramilitaries six days after she set up Capital Radio and aired a test broadcast, Gerry Jackson then launched SW Radio Africa.

And Facebook has become a key tool for finding stories, Jackson told today’s Guardian Activate London conference in a talk called “media in exile”.

Jackson spoke of the human rights abuses, corruption and repression in the country, and how the radio station and SW Radio Africa website aim to expose wrongdoings.

She told the conference that Zimbabwe is “trapped” as “nothing changes”.

We are groundhogs [like in the Bill Murray film Groundhog Day]. We are reliving the same day over and over. That’s what it feels like in Zimbabwe.

But although we are groundhogs and do the same stories over and over again, we do highlight stories that rest of the world doesn’t seem pick up on.

Jackson is particularly proud of the radio station’s exposes. The website published a leaked list of the names of 450 individuals who had allegedly committed acts of violence.

The expose received a “huge response on Facebook”, Jackson said. But explained that “people were very frightened to write publicly” so instead messaged the journalist who worked on the story to report details of further atrocities.

The reporters at SW Radio Africa also arrange most of their interviews via the platform. They are also aware that the ruling party “keeps a close eye on Facebook”.

Jackson said around one million people in the country of roughly 12 million are on Facebook, with two million internet connections and nine million mobile phones with 700,000 of those being used for internet access.

It’s impossible to underestimate how much Zimbabweans love Facebook.

She said that not only includes those within the country but Zimbabweans living in exile, which is perhaps one third of the total population.

And key political figures are on Facebook, including members of the Zanu-PF party.

It’s interesting to see their list of [Facebook] friends.

New record for Storify as US bus monitor Storify gets more than 1.5m views

Digital storytelling platform Storify has announced that a Storify produced by US journalist and student Ben Doernberg, which curated the latest responses and reaction to a video in which a bus monitor is seen being taunted (there’s more on this story from the BBC at this link), has hit a new record for Storify by recording more than 1.5 million views.

At the time of writing the number of views stood at 1,575,345. More than $650,000 has also been raised after an Indiegogo page was set up to give the bus monitor a holiday.

See the Storify about the record here.

#MarketBriefing: How audience measurement has increased digital revenues for Incisive Media

B2B publisher Incisive Media’s improved understanding of analytics has resulted in an increase in digital revenue and profit over the past two years, according to Jon Bentley, head of online commercial development.

Bentley told a conference on ‘audience revenue tools for online publishers’ today that Incisive has achieved an average of 10.34 minutes “dwell time” on its “gated” paid subscription sites, when the average dwell time is  7.55 minutes, according to analysis by AOP.

So what does Incisive do differently?

It measures analytics closely, both for subscription sites and those which do not require readers to pay, Bentley explained. In an introduction to the event, Patrick Smith, editor and chief analyst of TheMediaBriefing.com had put forward this idea saying:

It’s only through the measurement and analytics that you realise who might pay and why they might pay.

Incisive uses Web Analytics and Google Analytics and is starting to talk to Scout Analytics. Bentley detailed what Incisive has done over the past two years to improve the understanding of the audience:

  • It has improved governance and reviewed all analytics.
  • Defined and re-defined the business needs. It has done this by talking to people within the publishing business.
  • Incisive re-wrote its tagging strategy, technically categorising content types.
  • Integrated digital and offline data, merging email and web databases.
  • Developed communications.
  • Set up regular reviews.

The monthly analytics review “clinics”, which feature those from the web, commercial and editorial teams sitting round a table, are “probably the most successful thing we’ve done”, Bentley added.

As well as looking at unique users, page impressions, visits, active email addresses, – which are “one of the most valuable indicators you have” – Incisive also focuses on the sell-through rate, which “is one of the key indicators for revenue”.

Bentley echoed Patrick Smith who said earlier that “the measure of success is no longer about reach”.

It matters but who readers are and what they do is just as important.

#MarketBriefing: How the FT is measuring its shift to mobile

Multichannel analytics is key for the Financial Times, which is well known as a leader in understanding its audience and using the data to increase revenues.

The FT, which has 4.5 million registered users of its digital offering and 285,000 paying digital subscribers, has a team of 30 people focusing on web analytics, data and digital marketing for the title.

The digital subscriber base grew by 29 per cent last year, demonstrating how understanding the audience pays off.

Why audience analytics is key

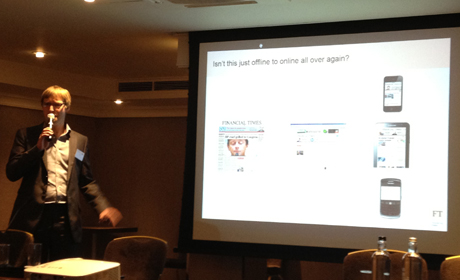
Tom Betts, head of web anaytics as the FT, told today’s ‘audience revenue tools for online publishers’ conference how it has grown its subscriber base and used data to help “fuel” their shift to mobile.

One of the things the FT has been doing for the past two or three years, Betts said, is personalising the communications with readers based on the types of editorial content they are are interested in.

The FT looks at customer DNA, at how much of each type of content, such as “markets”, “world”, “personal finance”, they read.

The FT can then tailor newsletters “to personalise the experience that people have with us”, Betts explained.

How mobile alters the digital landscape

But simply looking at digital analytics is not enough. Platform-specific data can give a better picture of the individual.

For example, Betts explained how if a reader has not read “weekend” or “personal finance” content online, it might be that they read it on a tablet or mobile when they are at home.

Mobile is altering the way our customers read our content.

And this information can turn into revenue. At least 20 per cent of new FT subscriptions comes from behaviour-driven data marketing, Betts said.

He also said it is essential to understand whether if people are engaging across platforms.

“Are the platforms generating a new audience or are we just moving the audience from one platform to another?” Betts asks the data, as that will dictate how much it is worth investing in digital offerings for different devices.

The FT famously created a web app in order to have a direct relationship with the customer, which it was not able to do with its previous iOS native iPad app.

As well as providing data from the web app and bypassing Apple’s 30 per cent levy, the technology behind the app also makes “deployment easier”, Betts said.

“HTML5 makes deployment easier” as the “core remains the same with different wrap-arounds” overlaid for the Android and Windows 8 native apps.

And looking at the data demonstrating when the various devices are used is also beneficial.

Betts demonstrated with a graph to show the main smartphone and tablet usage peaks at breakfast, with another rise in the evening.

Existing subscribers are not just reading during the business day.

They therefore get better value of their subscriptions and less likely to cancel.

Update: This post initially quoted Tom Betts as saying “everything we’ve done that has been successful at the FT has been related to data”. The FT would like to clarify that Betts was referring to the fact that “the intelligent use of data has been a significant driver of our commercial success”.