One of the sessions at today’s Guardian Activate Summit looked at how data and social media are influencing storytelling.
Here are four innovations, shared by Phil Fearnley, general manager, Future Media News & Knowledge, BBC; Stew Langille, CEO of Visually; Neal Mann, social media editor at the Wall Street Journal; and Simon Rogers, editor of the Guardian’s Datablog and Datastore.
1. The BBC gets ready for Olympic storytelling
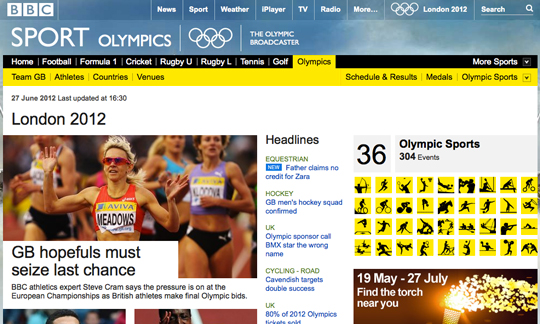
The BBC site for the London Olympics gives every athlete, venue and sport its own page and apart from the homepage all are updated automatically with with the latest video and story content on that particular topic.
The Olympics site also focuses on personalisation, giving the audience the ability to favourite an athlete or sport and follow.
Fearnley said the development of the site started two years ago.
We had to satisfy the ‘main eventers’ and the ‘sports fanatics’. And we wanted to give the idea that you were never missing a moment.

The other innovation shared by Phil Fearnley was the BBC’s “live event video player”.
Viewers can use the interactive video player to jump back to a particular point in an event, such as a triple jump win, and then switch back to a live report.
With “up to 24 live events at once”, the player gives an experience that, according to Fearnley audiences say “is better than TV”.
We are transforming the way we tell video stories to our audiences.
2. Visually is allowing journalists to create their own data visualisations.
Visually launched last year “to democratise the way people use and consume data”. Today, the site has more than 11,000 infographics, 4,000 designers, and around 2 million visitors per month. In March, it launched Visually Create, a collection of self-service tools that allow anyone to create beautiful infographics.
Stew Langille, CEO of Visually told the conference that the team is now developing further tools which will allow journalists or anyone interested in creating a visualisation to do so.
3. Ideas in ‘multilayered storytelling’
Neal Mann, social media editor at the Wall Street Journal (@fieldproducer on Twitter) talked of the potential of “multilayered storytelling”.
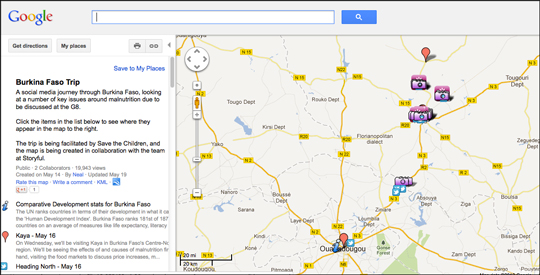
Before taking up his new role at the WSJ, Mann went to Burkina Faso.
He worked with Storyful, which built a map which added his social media updates, photos (Mann is also a photographer) which was auto updated and which he shared with his large social media following.

“It allowed people to engage,” Mann said, explaining that updates from a less reported area were “continuously dropping onto people’s phones”.
The map got five times as many hits as a Guardian’s long-form piece of journalism from Mozambique, he said.
Other ways journalists are sharing “background” to text stories are by taking 360 degree images from a location.
His thought is that if you marry the two storytelling techniques, a social media map and long-form journalism, it would be even more powerful.
If you can combine the two it’s a great way news organisations can get people to engage in long-form journalism. The next level for me is that multilayered storytelling.
4. Open journalism, open data
Simon Rogers, editor of the Guardian Datastore and Datablog, shared examples of the Guardian’s data journalism.
He spoke of the conversations that went on before the launch of the Datastore where there was a view that people would not be interested in the raw data. Three years on and it has one million viewers a month


