Tag Archives: Technology/Internet

ReadWriteWeb: Wikipedia as a breaking news source

From the ‘process journalism’ session at the SXSW Interactive event in Texas comes a discussion about Wikipedia as a news source. ReadWriteWeb reports:

Just like other news aggregation services, Wikipedia takes many sources and puts them in to a central location, but with the added benefit of human curation instead of algorithmic collection.

“There’s no real-time reporting going on in Wikipedia, it’s real-time aggregation,” Pantages [Moka Pantages, WikiMedia communications officer] said.

So the very first level of information vetting, which happens at the reporting level, has already taken place by the time it reaches the site. Then the hundreds or thousands of editors continue to scrutinize the information, discussing edits and potential changes in the back channels. The news we read in our daily newspapers, on the other hand, is curated by only a small number of people. Surely, there is the question of qualification, but many of Wikipedia’s contributors and editors are, themselves, professionals.

Full post at this link…

Must-read: PEJ’s annual State of the News Media report goes live

Each year the US Project for Excellence in Journalism (PEJ) produces a report on the State of the News Media, aggregating other reports on what has happened to news organisations during the previous 12 months and providing its own research into what lies ahead.

The 2010 report weighs in on paywalls, and why there’s still a “hill to climb”; the increasingly niche-focus of both traditional news organisations and new online-only players; and features a special report on the state of community media or citizen journalism projects.

It’s an incredibly thorough survey – featuring figures on changes in advertising spend across all sectors and analysis of news sites’ traffic figures – and is best read in full at this link.

Some highlight quotes:

Advertising:

  • 79 per cent of those surveyed said they had never or rarely clicked on an online ad.

News content:

  • “When it comes to audience numbers online, traditional media content still prevails, which means the cutbacks in old media heavily impact what the public is learning through the new.”
  • Online news coverage is still geared towards breaking news. New technologies for live reporting can provide a less vetted version of releases/press conferences;
  • BUT: “While technology makes it easier for citizens to participate, it is also giving newsmakers more influence over the first impression the public receives.”
  • News organisations are becoming disseminators rather than gatherers of news, and becoming more reactive than proactive.

Social media:

  • Eventually, the news operations that develop social networking strategies and distribution mechanisms well might be able to convince advertisers that they have special access to attractive news consumers – especially those who influence the tastes of others;
  • Blogging, amongst news consumers, is declining in frequency;
  • 80 per cent of links from blogs and social media sites studied are to US legacy media.

Niche news:

  • “Old media are trying to imagine the new smaller newsroom of the future in the relic of their old ones. New media are imagining the new newsroom from a blank slate.”
  • “Online, it is becoming increasingly clear, consumers are not seeking out news organisations for their full news agenda.”

More on the report’s take on niche news at this link…

Marking the World Day Against Cyber Censorship

“Against the enemies of the internet”  – this is the short but incisive message for today’s World Day Against Cyber Censorship, organised by press freedom campaign group Reporters Without Borders (RSF).

Jean-Francois Julliard, secretary-general of RSF, explains the day in this video:

To mark the day, RSF has published an article, ‘Web 2.0 versus Control 2.0’, emphasising the idea of the internet as a force for democracy and freedom.

The fight for free access to information is being played out to an ever greater extent on the Internet. The emerging general trend is that a growing number of countries are attempting to tighten their control of the net, but at the same time, increasingly inventive ‘netizens’ demonstrate mutual solidarity by mobilizing when necessary.

Last night RSF, with support from Google, awarded the inaugural Netizen Prize to the Iranian creators of website Change for Equality, “a well-known source of information on women’s rights in Iran […] and rallying point for opponents of the regime.”

New financial stocks site for Wikia; hopes to attract whistleblowers

In an interview with Bloomberg Television, Jimmy Wales, co-founder of Wikipedia and also internet media company Wikia, reveals that he has recently bought a new stocks site, which he hopes whistleblowers will contribute to. Value Wiki is now part of Wikia, his consumer publishing company (Wikipedia is part of the non-profit Wikimedia Foundation).

[I] just bought a site called Value Wiki which is about stocks and we’re hoping people will come forward, maybe whistle blowers, whoever, will come forward with some information about companies.  The same thing can happen to politicians.

Wales also spoke about the accuracy and editorial issues for his encyclopedia, Wikipedia:

We’re trying to look at different software tools that allow the community to monitor what’s going on. There’s always a core of good people managing Wiki who really want it to be high quality. The main thing is making sure that they have what they need.

[Hiring editors] doesn’t even seem like the right approach to us. When we really dig in deep and we look at where there are problems, and what the problems are, they’re never about not having enough core people who are really passionate about it but about making sure the software tools are available to them.

Paywalls and entrepreneurship: Journalism.co.uk on BBC News Channel

Journalism.co.uk featured on the BBC News Channel technology programme Click at the weekend. Our founder and publisher John Thompson (@johncthompson) was interviewed about our model for providing media industry news content – outside the paywall. The programme also featured Guardian editor Alan Rusbridger and City University London newspaper journalism course director Jonathan Hewett, among others.

Here’s a link to the point at which Journalism.co.uk features:

A social media documentary coming this spring

A new Canadian documentary film, due out this spring, uses social media to tell an alternative story about Vancouver’s Winter Olympics. It follows four individuals who “rallied” their community through social networking tools, to help empower the homeless and poor – who don’t necessarily fit into grand Olympic plans. The idea was to use mobile and online media to “provide a voice for those left behind”. (Hat-tip: Jon Slattery)

It draws on video blogging, photo-sharing and social networking to bring a “marginalised” community to the fore, “embracing leading-edge communication technologies, to empower, inspire, and break down the digital divide,” its producers say. The synopsis:

February 12, 2010.  Sixty thousand people have gathered in Vancouver’s BC Place Stadium to revel in the spectacle that is the opening ceremonies of the Winter Olympic Games. It marks the beginning of a two week party that will focus a global spotlight on this city of half a million and, organizers hope, finally put to rest seven years of  surrounding controversy. A few days earlier, a year long campaign which saw police issue hundred dollar jaywalking and spitting tickets to homeless people, had culminated in a successful sweep of the city’s impoverished Downtown Eastside to relocate undesirables to outlying communities.

When the story finally makes it to the mainstream news channels, it’s thanks to the diligence and combined power of a few concerned citizens, their video-streaming cellphones and the Internet. With Glowing Hearts will give audiences the chance to see the world through the eyes of four such citizens, as they rally their community around powerful new Social Media tools to show its true heart to the world. Based on the premise that the access to information is a human right, the film and accompanying website, will take audiences on a year long journey into the creation of an independent Olympic media center designed to guarantee that access  in a community whose voice is frequently ignored.

Here’s the site.

Here’s the trailer:

With Glowing Hearts from Andrew Lavigne on Vimeo.

How media sites can make use of linked data

Martin Belam, information architect for the Guardian and CurryBet blogger, reports from today’s Linked Data meet-up in London, for Journalism.co.uk.

The morning Linked Data meet-up session at ULU was part of a wider dev8d event for developers, described as ‘four days of 100 per cent pure software developer heaven’. That made it a little bit intimidating for the less technical in the audience – the notices on the rooms to show which workshops were going on were labelled with 3D barcodes, there were talks about programming ‘nanoprojectors’, and a frightening number of abbreviations like RDF, API, SPARQL, FOAF and OWL.

What is linked data?

‘Linked data’ is all about moving from a web of interconnected documents, to a web of interconnected ‘facts’. Think of it like being able to link to and access the relevant individual cells across a range of spreadsheets, rather than just having a list of spreadsheets. It looks a good candidate for being a step-change in the way that people access information over the internet.

What are the implications for journalism and media companies?

For a start it is important to realise that linked data can be consumed as well as published. Tom Heath from Talis gave the example of trying to find out about ‘pebbledash’ when buying a house.

At the moment, to learn about this takes a time-consuming exploration of the web as it stands, probably pogo-sticking between Google search results and individual web pages that may or may not contain useful information about pebbledash. [Image below: secretlondon123 on Flickr]

In a linked data web, finding facts about the ‘concept’ of pebbledash would be much easier. Now, replace ‘pebbledash’ as the example with the name of a company or a person, and you can see how there is potential for journalists in their research processes. A live example of this at work is the sig.ma search engine. Type your name in and be amazed / horrified about how much information computers are already able to aggregate about you from the structured data you are already scattering around the web.

Tom Heath elaborates on this in a paper he wrote in 2008: ‘How Will We Interact with the Web of Data?‘. However, as exciting as some people think linked data is, he struggled to name a ‘whizz-bang’ application that has yet been built.

Linked data at the BBC

The BBC have been the biggest media company so far involved in using and publishing linked data in the UK. Tom Scott talked about their Wildlife Finder, which uses data to build a website that brings together natural history clips, the BBC’s news archive, and the concepts that make up our perception of the natural world.

Simply aggregating the data is not enough, and the BBC hand-builds ‘collections’ of curated items. Scott said ‘curation is the process by which aggregate data is imbued with personalised trust’, citing a collection of David Attenborough’s favourite clips as an example.

Tom Scott argued that it didn’t make sense for the BBC to spend money replicating data sources that are already available on the web, and so Wildlife Finder builds pages using existing sources like Wikipedia, WWF, ZSL and the University of Michigan Museum of Zoology. A question from the floor asked him about the issues of trust around the BBC using Wikipedia content. He said that a review of the content before the project went live showed that it was, on the whole, ‘pretty good’.

As long as the BBC was clear on the page where the data was coming from, he didn’t see there being an editorial issue.

Other presentations during the day are due to be given by John Sheridan and Jeni Tennison from data.gov.uk, Georgi Kobilarov of Uberblic Labs and Silver Oliver from the BBC. The afternoon is devoted to a more practical series of workshops allowing developers to get to grips with some of the technologies that underpin the web of data.

Technology: both good and bad for human rights

At an interactive event at Amnesty UK on Monday, the panel, audience and back-channel contributors (tweets were beamed up on a screen behind) discussed the pros and cons of using technology for human rights. The underlying conflict was this: repressive governments and regimes can make as much use of new technology as pro-democracy activists.

The panel included Google’s head of public policy and government relations, Susan Pointer; Guardian’s digital media research editor, Kevin Anderson; Annabelle Sreberny, professor of global media and communication at SOAS; and author and blogger Andrew Keen: who spoke from the US via an iPhone held up to the mic by the event chair, BBC technology correspondent Rory Cellan-Jones.

At the end, the conversation turned to Amnesty’s own changing use of technology to fight battles: letters were still important, said Steve Ballinger from its media unit. While email now played an important role, there was still something very “physical” about sending a letter, he said.

The event was put on by the human rights charity to promote its annual media awards, which freelancers, or journalists at small online publications, may be able to enter for free.

Amnesty also used the occasion to remind us of the plight of two bloggers from Azerbaijan. After producing a spoof YouTube video critical of the Azeri government last year, the youth activists were sentenced to prison; Emin Abdullayev for 2.5 years; Adnan Hajizade for two years. An appeal hearing is due for 3 March. Amnesty is calling for people to send protest emails to the minister of justice in Azerbaijan at this link.

Data visualisations that tell the news

The Linked and Open Data conversation is extremely relevant for news telling and I’m hoping this week’s Linked Data meetup – Web of Data – will introduce me to some new ideas which could be used effectively in journalism. There’s some incredibly inspiring stuff going on outside traditional newsrooms, but some media organisations have also been building some fantastic interactive features on their sites, which allow users to customise the way they view and consume data.

Last month at the first official UK Future of News Group meeting, the Financial Times deputy interactive editor, Cynthia O’Murchu, shared some inspiring ways of news storytelling. She later sent me a list of inspirational links, which I’ll share with you here.

O’Murchu believes that data visualisations can add so much value to a story, and allow more user control, too. The great thing about various data visualisations was that “you allow people to choose their story”, she said. Here are some of the visualisations she flagged up in particular:

[Note: for FT.com articles, you will need to register or subscribe to receive full access after a limited number of views]

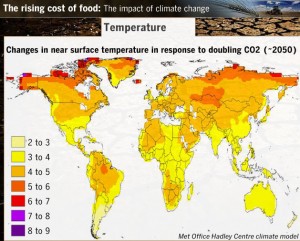
This Financial Times feature from 2007 mapped the different factors affecting food prices around the world: export restrictions, price measures, civil unrest, trade balances and inflation. Additional text boxes, brought up by clicking on a certain location, give additional information.

Another feature brought together video and slide shows that explain why food prices are rising.

It was about presenting things in a comprehensible way for users to understand, said O’Murchu.

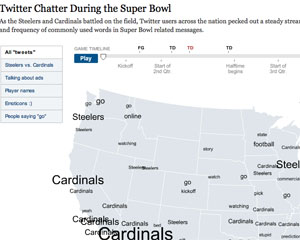
She flagged up how the New York Times had used geolocal information to show what people were talking about on Twitter (see below, for example).

O’Murchu urged the room of journalists to go and play with data tools: “If you’re inclined to do a type of story telling, just do it!”

Some of the other interactive packages at the FT:

Data visualisations:

She also showed examples of applications that helped users customise information, to help with a particular problem:

O’Murchu also mentioned the non-profit information site Gapminder. In this video, Gapminder’s Hans Rosling shows users how countries have developed since 1809, based on individual life expectancy and income. [You can see another Rosling video here, ‘Let my dataset change your mindset’].

O’Murchu also recommends taking a look at these links, for further inspiration:

And finally, for even more examples of interactive graphics:

What are your favourites? Add them in the comments below…