Tag Archives: data

#followjourn – @smfrogers Simon Rogers/data journalist

Who? Simon Rogers

Where? Simon Rogers is editor of the Guardian Datablog and Datastore. Hear him speak about open data in this week’s podcast.

Twitter? @smfrogers

Just as we like to supply you with fresh and innovative tips, we are recommending journalists to follow online too. Recommended journalists can be from any sector of the industry: please send suggestions (you can nominate yourself) to Rachel at journalism.co.uk; or to @journalismnews.

Tool of the week for journalists: Data.gov.uk’s map-based search

Tool of the week: Data.gov.uk’s map-based search

What is it? An option of searching for data sets by geographical location

How is it of use to journalists? Since the launch of Data.gov.uk just over two years ago, and the promotion of open government data, the site has become a go to place for many journalists in search of a data set.

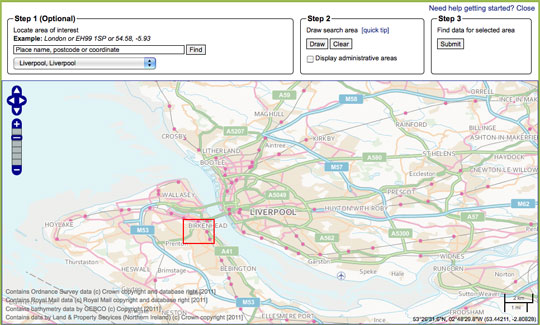
The site now has a map tool which allows you to search for data by location, potentially useful for journalists working on local news sites, newspapers and radio stations.

The map-based search allows you to draw a search area, submit the area and find data relating to that location.

Not tried your hand at data journalism? This guide written for Journalism.co.uk by Simon Rogers, editor of the Guardian’s Datablog tells you how to get a grip with data journalism.

  • Journalism.co.uk also offers a one or two-day course in data journalism, led by Kevin Anderson. The next introduction to data journalism courses are being held on 9 May or 28 May. The intermediate data journalism course will be on 29 May. Those looking to expand their skills quickly can book on both courses, turning it into a two-day course and saving £50 on the course fees.

#Tip of the day from Journalism.co.uk – using spreadsheets for data stories

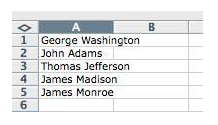
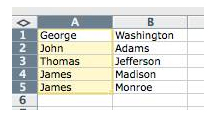
Poynter has a helpful lesson in Excel and other spreadsheet software for journalists dealing with data.

The post explains how to split names in a single column to two columns, for example.

Poynter’s post on how journalists can use Excel to organise data for stories is at this link.

There will be a workshop on data journalism – led by Simon Rogers, editor of the Guardian’s Datastore and Datablog – at Journalism.co.uk’s news:rewired – media in motion conference for journalists. The news:rewired agenda is at this link.

Tipster: Sarah Marshall

If you have a tip you would like to submit to us at Journalism.co.uk email us using this link– we will pay a fiver for the best ones published.

What’s happening to mark open data day

The use of open data in our newsrooms has been growing in the past few years and many people believe that the future of data journalism relies on the collaboration between developers, designers and journalists to create better ways of extracting information from open datasets.

Tomorrow (3 December) is International Open Data Day and there is a series of worldwide events set up to gather coders, programmers and journalists around “live hacking” challenges.

International Open Data Hackathon

Where? The Barbican in London and around the world

When? Saturday, 3 December from 11am

Better tools. More Data. Bigger Fun. That’s how the 2011 Open Data Day Hackathon describes this year’s global event, taking place in more than 32 countries this weekend.

For journalists, it’s an occasion to give hacking a go and meet people from the world of data.

The past year has seen open data continue to gain traction around the world with new open data catalogues launched in Europe, North America and Africa and more data available from organisations such as the World Bank.

Open Data Day is a gathering of citizens in cities around the world to write applications, liberate data, create visualisations and publish analyses using open public data. Its aim is to show support for and encourage the adoption of open data policies by the world’s local, regional and national governments.

Join the Open Knowledge Foundation and CKAN at the Barbican tomorrow (Saturday, 3 December) as they assemble a “crack-team” of coders to break data out of its internet prisons and load it into the Data Hub.

For details about the event, see this blog post, and sign up on the event’s meetup page or by filling out the event’s Google form.

Participants will be on IRC and will also be using the hashtags #seizedata and #odhdLDN on Twitter. All journalists, data scrapers, coders and #opendata enthusiasts can join.

David Eaves, the organiser of this year’s Open Data Hackathon believes this event is a great opportunity to teach journalists, as well as the general public, how to tackle data on a day-to-day basis:

Its a Maker Faire-like opportunity for people to celebrate open data by creating visualisations, writing up analyses, building apps or doing what ever they want with data.

What I do want is for people to have fun, to learn, and to engage those who are still wrestling with the opportunities around open data … And we’ve got better tools. With a number of governments using Socrata there are more API’s out there for us to leverage. ScraperWiki has gotten better and new tools like Buzzdata, the Data Hub and Google’s Fusion Tables are emerging every day.

Who’s it for? Everyone. David Eaves says:

If you have an idea for using open data, want to find an interesting project to contribute towards, or simply want to see what’s happening, then definitely come along.

You can also check out the HackFest 2011 topic page on BuzzData.

London “Random Hacks of Kindness” event

Where? @Forward in London, and around the world

When? 3-4 December 2011, from 9am Saturday until 6pm Sunday

Starting on the same day as the Open Data Hackathon, the Random Hacks of Kindness’ Codesprint will gather thousands of experts in 25 countries to develop open tech solutions over two days of hacking challenges.

The unprecedented gatherings in collaboration with Google, Microsoft, Yahoo!, NASA, HP and the World Bank will bring together some of the world’’ most innovative social enterprises and volunteer technologists.

London’s event promises to be exciting as over 100 tech heads will gather to tackle one issue: financial exclusion and illiteracy. It will be the first ever hack day addressing this theme.

Financial and enterprise education group MyBnk will head a panel of CEOs and IT specialists from LSE, Morgan Stanley, Fair Finance, Three Hands, Toynbee Hall and the Forward Foundation to make major advances in helping young people master money management.

Mike Mompi, head of strategy and innovation at My BNK and the organiser of London RHoK event says:

The main objectives of the weekend are problem solving, capacity building, partnerships, and impact

A £500 cash prize will be given at the end of Sunday for the winning solution (among other prizes) and several media organisations, including The Huffington Post, will be joining in.

People from RHoK have hosted three global events to date, in 31 cities around the globe with over 3,000 participants. Past events resulted in apps and alert systems to warn people of bushfires in Australia and recipients of food stamps to sources of fresh produce in Philadelphia.

The RHoK community is open for anyone to join.

If you want to get an idea of what’s in store for this weekend, check out last year’s hackathon videos.

You will be able to follow the event on Twitter @RHoKLondon and the hashtag #rhokLDN. It is still possible to sign up for this weekend’s free event via this link.
How open data has changed journalism

Tomorrow (Saturday 3 December) is International Open Data Day. We have been asking what the open data movement has done for journalism.

Simon Rogers, editor of the Guardian’s Datablog and Datastore – @smfrogers

It’s only been a couple of years and you could argue that open data has changed the world: Wikileaks, government spending, what we know about the riots… The irony is that the governments behind much of this data have only contributed the numbers; the hard work has been done by an army of developers and data journalists who have created stories and new ways of telling them. When we started the Datablog in 2009, we thought it would be popular only with developers; now everyone wants to know the facts behind the news.

Nicola Hughes@DataMinerUK

It’s the knowing how to use it that’s vital. it’s a (re)source.

Borja Bergareche@borjabergareche

It’s helped us do the best journalism of the 20th century in the 21st century.

Lucy Chambers, community coordinator, Open Knowledge Foundation – @lucyfedia

Evidence-based journalism. Journalists will back up stories, readers will expect to be able to verify facts.

Andrew Gregory@andrew__gregory

Open data is useful. But original journalism also requires good human sources.

Rune Ytreberg –  @ytreberg

The obvious: Open data has made journalism more transparent.

Megan Cunningham@megancunningham

Open data has accelerated the opportunities for crowd sourced investigative journalism. But the potential hasn’t been realised.

Harriet Minter@Harriet_Minter

It’s forced journalists to embrace spreadsheets, brought interactives to the forefront and given us many bad infographics.

Greg Hadfield@GregHadfield (who is organising the UK’s first open-data cities conference)

Data – whether open or not – has always fuelled journalism. Data that is increasingly “open” (in the fullest sense of the term) will transform journalism.

Ironically, a lot of the best revelatory journalism of the past has depended on journalists unearthing data (ie “stuff”) that others want to keep locked. Ideally, by lawful means. Therefore, openness may remove some of the mystique that journalists delight in, as people who know things that only those “in the know” know.

An open-data tsunami will mean that more journalism will be about interpreting – and putting into context – data that is open to all, at least in its rawest, unrefined form.

To an even greater degree, journalism will be about adding value to data by transforming it into information. The best journalism will be to add value to information, to provide insight, even wisdom.

Openness of data will change the behaviour of individuals and organisations. But not immediately and not in every case. Would MPs have played fast and loose with their expenses if they knew data about each claim would be published openly and in real time? Sad to say, it is quite possible some would.

Much good journalism has involved shedding light on data that was routinely (although not widely) available and which was only rarely studied or analysed.

Importantly, some of the best journalism has involved making connections and spotting patterns. I’m thinking of earlier parliamentary abuses, such as the “cash-for-questions” scandal of the mid-1990s, before Hansard was on the web, and when it was rarely read in print by journalists.

Those were the days when typewriters and telephones – rather than computers and the internet – were the primary journalistic tools. When bars and restaurants – rather than offices and desktops – were the venues for journalistic enterprise.

With more data openly available – along with more tools easily available for mining, sifting and interpreting it (as in the case of the Wikileaks material) – there are many more needles to be found in the burgeoning haystacks of unstructured data.

But even when every day is #Opendata Day, the best stories may remain hidden in full public view – until one of the new generation of journalists stumbles expertly across them.

Tool of the week for journalists – Playground, to monitor social media analytics

Tool of the week: Playground, by PeopleBrowsr.

What is it? A social analytics platform which contains over 1,000 days of tweets (all 70 billion of them), Facebook activity and blog posts.

How is it of use to journalists? “Journalists can easily develop real-time insights into any story from Playground,” PeopleBrowsr UK CEO Andrew Grill explains.

Complex keyword searches can be divided by user influence, geolocation, sentiment, and virtual communities of people with shared interests and affinities.

These features – and many more – let reporters and researchers easily drill down to find the people and content driving the conversation on social networks on any subject.

Playground lets you use the data the way you want to use it. You can either export the graphs and tables that the site produces automatically or export the results in a CSV file to create your own visualisations, which could potentially make it the next favourite tool of data journalists.

Grill added:

The recent launch of our fully transparent Kred influencer platform will make it faster and easier for journalists to find key influencers in a particular community.

You can give Playground a try for the first 14 days before signing up for one of their subscriptions ($19 a month for students and journalists, $149 for organisations and companies).

Jodee Rich, the founder of PeopleBrowsr, gave an inspiring speech at the Strata Summit in September on how a TV ratings system such as Nielsen could soon be replaced by social media data thanks to the advanced online analytics that PeopleBrowsr offers.


Playground’s development is based on feedback from its community of users, which has been very responsive. Ideas can be sent to contact[@]peoplebrowsr.com or by tweeting @peoplebrowsr.

Currybet: There is a lot of data journalism to be done on riots

In a blog post today (12 August), information architect at the Guardian, Martin Belam, calls on journalists to make the most of the data now available in relation to the riots which took place this week.

He says using the data is “vital” and the resulting journalism will have the power to “help us untangle the truth from those prejudiced assumptions”. But he adds about the importance of ensuring the data is not misinterpreted in time to come.

The impact of the riots is going to be felt in data-driven stories for months and years to come. I’ve no doubt that experienced data crunchers like Simon Rogers or Conrad Quilty-Harper will factor it into their work, but I anticipate that in six months time we’ll be seeing stories about a sudden percentage rise in crime in Enfield or Central Manchester, without specific reference to the riots. The journalists writing them won’t have isolated the events of the last few days as exceptions to the general trend.

… There can be genuine social consequences to the misinterpretation of data. If the postcodes in Enfield become marked as a place where crime is now more likely as a result of one night of violence, then house prices could be depressed and insurance costs will rise, meaning the effects of the riots will still be felt long after broken windows are replaced. It is the responsibility of the media to use this data in a way that helps us understand the riots, not in a way that prolongs their negative impact.

Read his full post here…

This followed a blog post by digital strategist Kevin Anderson back on Sunday, when he discussed how the circumstances provide an opportunity for data journalists to work with social scientists and use data to test speculated theories, with reference to the data journalism which took place after the 1967 riots in Detroit.

… I’m sure that we’ll see hours of speculation on television and acres of newsprint positing theories. However, theories need to be tested. The Detroit riots showed that a partnership amongst social scientists, foundations, the local community and journalists can prove or disprove these theories and hopefully provide solutions rather than recriminations.

BuzzData, a ‘social network for people who work with data’

Data gets its own social network today (2 August), with the launch of BuzzData, which its CEO describes as “a cross between Wikipedia for data and Flickr for data”.

BuzzData is due to launch in public beta later when Canada, where the start-up is based, wakes up.

It launched in private beta last week to allow a few of us to test it out.

What is BuzzData?

BuzzData is a “social network for people who work with data”, CEO Mark Opausky told Journalism.co.uk.

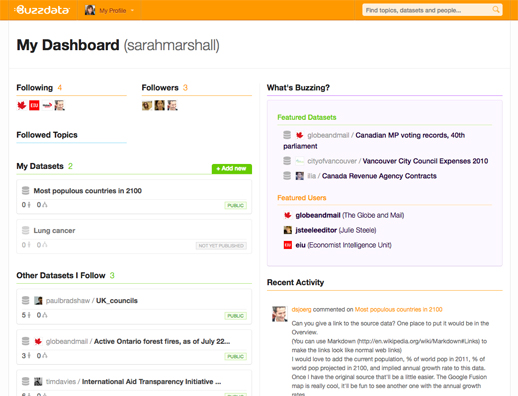
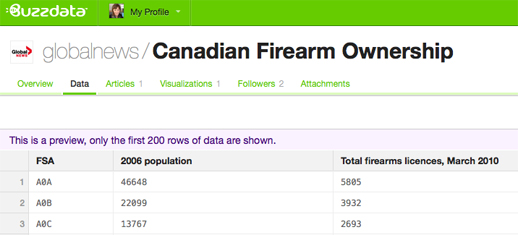
Users can upload data, data visualisations, articles and any background documentation on a topic or story. Other BuzzData users can then follow your data, comment on it, download it and clone it.

Members of the Toronto-based team hope the platform will be a space where data journalists come together with researchers and policy makers in order to innovate.

They have thought about who could potentially use the social network and believe there are around 15 million people who deal with statistics – whether that data be around sport, climate change and social inequalities – and who are “interested in seeing the data and the conversation that goes on around certain pieces of data”, Opausky said.

We are a specialised facility for people who wish to exchange data with each other, share data, talk about it, converse on it, clone it, change it, merge it and mash it up with other data to see what kind of innovative things may happen.

BuzzData does not allow you to create data visualisations or upload them in a way which makes beautiful graphics immediately visible. That is what recently-launched tool Visual.ly does.

How is BuzzData of use to journalists?

BuzzData allows you to share data either publicly or within a closed network.

Indeed, a data reporter from Telegraph.co.uk has requested access to see if BuzzData could work for the newspaper as a data-publishing platform, according to a member of BuzzData’s team.

Opausky explained that journalists can work by “participating in a data conversation and by initiating one” and gave an example of how journalism can be developed through the sharing of data.

It allows the story to live on and in some cases spin out other more interesting stories. The journalists themselves never know where this data is going to go and what someone on the other side of the world might do with it.

Why does data need a social network?

Asked what sparked the idea of BuzzData, which has secured in excess of $1 million funding from angels investors, Opausky explained that it was down to a need for such a tool by Peter Forde, who is chief technology officer.

He had spent many years studying the data problem and he was frustrated that there wasn’t some open platform where people could work together and share this stuff and he had a nagging suspicion that there was a lot of innovation not happening because information was siloed.

Going deeper than that, we recognised that data itself isn’t particularly useful until you can put it into context, until you can wrap it around a topic or apply it to an issue or give it a cause. And then even when you have context the best, at that point, you have is information and it doesn’t become knowledge until you add people to it. So his big idea was let’s take data, let’s add context and lets help wrap communities of people round this thing and that’s where innovation happens.

You can sign up for BuzzData at this link. Let us know what you think by leaving a comment below.


Three tools to analyse Google searches: Correlate, Trends and Insights

Google has three useful tools for journalists interested in looking at search trends over time, which also offer hours of fun for SEO enthusiasts. Google Correlate has been added to the list of analysis options within the past month, joining Insights and Trends which have been around for about three years.

Here is a brief introduction to each:

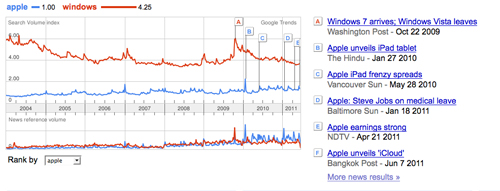
1. Google Trends works by you entering up to five search words and the results show how often those words have been searched for in Google over time. Google Trends also shows how frequently those search words have appeared in Google News stories, and in which geographic regions people have searched for them most.

For example, if you enter ‘Apple’ and ‘Windows’ you will see that ‘Windows’ is a far more popular search word, but when it comes to news, Apple appears in far more Google News stories. Evidence that journalists favour Apple stories than Windows ones, perhaps? Or do ‘Windows’ searches include vast numbers of people looking for double glazing?

Not only does Trends show you key events – such as the launch of the iPad – on the search volume time line, it also shows the volume of searches by country.

There is also a feature called Google Hot Trends which shows current searches and therefore hot topics. Combine google trends with SimilarContent tool for content optimization can help in Identifying the most relevant blogs for your target keyword, Identifying the most relevant news sites for your target keyword and Identifying the most relevant forums for your target keyword.

2. Google Correlate, launched by Google Labs at the end of last month, is like Google Trends in reverse.

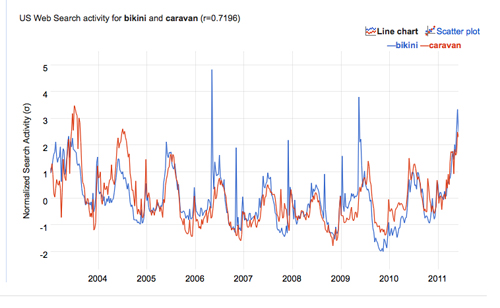
Correlate enables you to find queries with a similar pattern. You can upload your own data, enter a search query or select a time frame and get back a list of queries that follows a similar pattern to your search. You can also download the search results as a CSV file.

For example, if you enter the term ‘bikini’, Google Correlate will tell you a search term it closely correlates with is ‘caravan’, another being ‘Oakley sunglasses’. All are seasonal, so it is perhaps not that surprising those three searches correlate.

The inspiration behind Correlate was search patterns for flu (such as sore throat) correlating with peaks in actual flu activity. This comic book explanation tells the story brilliantly.

Another way of getting to grips with Correlate is having a go with this nifty drawing option. Simply drag and drop the pen and find out what searches match the time pattern you have drawn.

Be aware that Google Correlate uses US search data only, so it may be less useful to UK journalists. The New Scientist tested it out and it passed the magazine’s severe weather test and Google used it to track dengue fever hubs, the BBC reported.

3. Google Insights is one step up from Trends in terms of being able to provide a more detailed search. Results can be easily embedded in news stories.

One of the many useful things about Insights is it can be used to determine seasonality. For example, a ski resort may want to find out when people search for ski-related terms most often.

To see the potential of Insights look at example search comparisons, such as this one for Venus Williams and Serena Williams.

Visualisation shows the topics New York Times journalists are writing about

The Visual Communication Lab, part of the IBM Center for Social Sofware has created a site to provide a visualisation to show what subjects New York Times journalists are writing about.

NYT Writes, created by research developer Irene Ros, allows users to enter a subject and see a visualisation of the journalists who have written on that subject.

This post on the VCL blog explains what the visualisation shows.

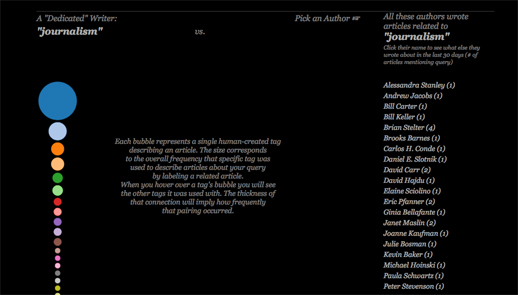
There are a few things that you will see once the search is complete. First, on the left side of the screen you will see a stack of bubbles at varying sizes. Each bubble represents a term, or “facet”, that was used to describe one or more articles containing your search query.

Facets get manually attached to each article by the New York Times staff. An article about “Tsunami” might be tagged as being about “Natural Disasters,” for example. The size corresponds to the relative amount of times that tag appeared comparing to all the other facets collected from all other articles in the query set.

You can mouse over each bubble to see the tag name appear in the middle as well as how much it appeared relative to the other facets below the stack itself. This stack could also represent what I call a “dedicated writer” – someone who only writes about one topic for 30 days would have a similar stack to this one.

You can try out NYT Writes at this link