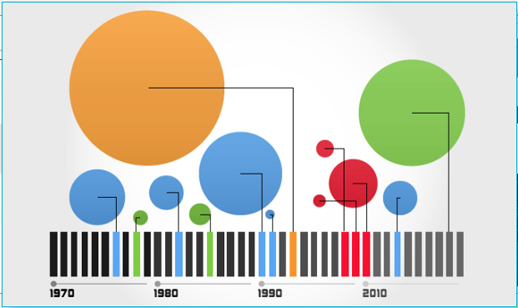
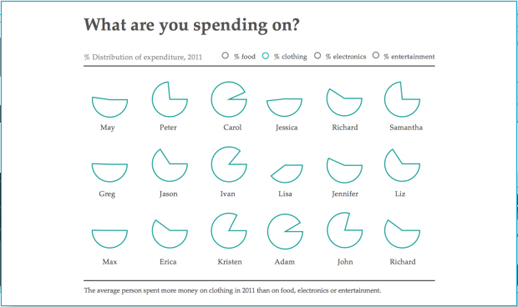
Visual.ly is a new platform to allow you to explore and share data visualisations.
According to the video below, it is two things: a platform to upload and promote your own visualisations and a space to connect “dataviz pros”, advertisers and publishers.
Visual.ly has teamed up with media partners, including GigaOM, Mashable and the Atlantic, who each have a profile showcasing their data visualisations.
You will soon be able to create your own “beautiful visualisations in minutes” and will “instantly apply the graphics genius of the world’s top information designers to your designs”, the site promises.
Plug and play, then grab and go with our push-button approach to visualisation creation.
The sample images are impressive, but journalists will have to wait until they can upload their own data.
You can, however, “Twitterize yourself” and create an image based on your Twitter metrics.

