Category Archives: Handy tools and technology

Storify adds slideshow view for blog posts, presentations and broadcasts

You can now view Storify stories as slideshows. The platform, which allows you to curate social media and web content, now lets you convert any Storify to a slideshow by simply adding “/slideshow” at the end of the URL of a Storify.

You can then embed the slideshow into a blog post or article. There are details of how to do that in this Storify blog post.

For example, Joseph Stashko has created this Storify on Steve Jobs’ stepping down as CEO of Apple. Here it is as a slideshow.

According to a post on Storify’s blog:

Slideshows were originally designed for TV, to make it easy to show a story on a monitor during a newscast or other show. But really, they could be used for anything – displays at live events such as conferences, or also for business and social media presentations created with Storify.

The full Storify blog post is at this link.

Tool of the week for journalists – WhoReTweetedMe

Tool of the week: WhoReTweetedMe

What is it? The name says it all. WhoReTweetedMe was launched less than a week ago (although the headline below suggests it may now be called WhoTweetedMe due to the troublesome name and URL when written in lower case).

How is it of use to journalists? It allows you to see who has tweeted a particular article.

Announcing that he had created the tool, social media scientist at HubSpot Dan Zarrella said:

Simply enter the URL of a recent (between one day and two weeks old) blog post, click the button and wait a moment. You’ll see a report containing the timeline of tweets to that URL, statistics about potential reach and average follower count of retweeters as well as a list of the 20 most influential users to tweet the link.

There’s also a bookmarklet you can drag to your bookmarks bar. Navigate to the page you want to analyse and click on the bookmark to see the WhoReTweetedMe.com report.

The tool is still very beta, so don’t be surprised if you see some errors, but I think it’s valuable enough to release now.

Facebook to take on BBM and Google+ with new phone messaging app

Facebook is launching a messaging app to rival the BBM instant messaging service available on Blackberry phones and elements of Google+.

The app will allow groups of friends or contacts (think Google+ circles) to be able to message one another from an iPhone or Android phone. Messages will then be saved and appear in your Facebook inbox.

According to a post on the Facebook blog:

Messenger is a separate app, so it only takes one click to get to your messages or send a new one. Messages are delivered through notifications and texts, so your friends are more likely to get them right away.

The Messenger app is an extension of Facebook messages, so all your conversations are in one place, including your texts, chats, emails and messages. Whether you’re on your phone or on the web, you can see the full history of all your messages.

Messenger will be available for both iPhone and Android starting today. Just search for “Facebook Messenger” in your phone’s app store, or get a link to the app texted to your phone.

Facebook’s full blog post is at this link.

London riots: Five ways journalists used online tools

Since riots started in London on Saturday, 6 August, journalists – and many non-journalists, who may or may not think of themselves as citizen reporters – have been using a variety of online tools to tell the story of the riots and subsequent cleanup operation.

Here are five examples:

1. Maps

James Cridland, who is managing director of Media UK, created a Google Map – which has had more than 25,000 views.

Writing on his blog (which is well worth a read), Cridland explains how and why he verified the locations of riots before manually adding reports of unrest to his map one by one.

I realised that, in order for this map to be useful, every entry needed to be verified, and verifiable for others, too. For every report, I searched Google News, Twitter, and major news sites to try and establish some sort of verification. My criteria was that something had to be reported by an established news organisation (BBC, Sky, local newspapers) or by multiple people on Twitter in different ways.

Speaking to Journalism.co.uk, he explained there was much rumour and many unsubstantiated reports on Twitter, particularly about Manchester where police responded by repeatedly announcing they had not had reports of copycat riots.

A lot of people don’t know how to check and verify. It just shows that the editor’s job is still a very safe one.

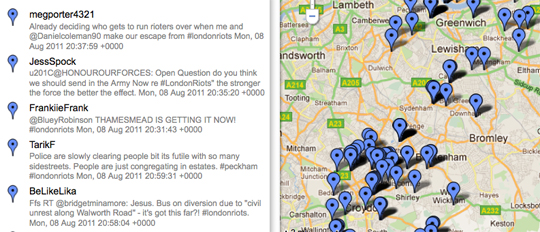
Hannah Waldram, who is community co-ordinator at the Guardian, “used Yahoo Pipes, co-location community tools and Google Maps to create a map showing tweets generated from postcode areas in London during the riots”. A post on the OUseful blog explains exactly how this is done.

Waldram told Journalism.co.uk how the map she created last night works:

The map picks up on geotagged tweets using the #Londonriots hashtag in a five km radium around four post code areas in London where reports of rioting were coming in.

It effectively gives a snapshot of tweets coming from a certain area at a certain time – some of the tweets from people at home watching the news and some appearing to be eyewitness reports of the action unfolding.

2. Video

Between gripping live reporting on Sky News, reporter Mark Stone uploaded footage from riots in Clapham to YouTube (which seems to have inspired a Facebook campaign to make him prime minister).

3. Blogs

Tumblr has been used to report the Birmingham riots, including photos and a statement from West Midlands Police with the ‘ask a question’ function being put to hugely effective use.

4. Curation tools

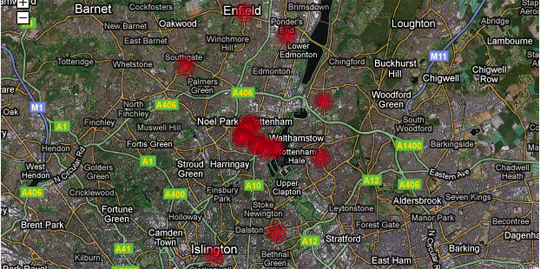
Curation tools such as Storify, used to great effect here by Joseph Stashko to report on Lewisham; Storyful, used here to tell the story of the cleanup; Bundlr used here to report the Birmingham riots, and Chirpstory, used here to show tweets on the unravelling Tottenham riots, have been used to curate photos, tweets, maps and videos.

5. Timelines

Channel 4 News has this (Flash) timeline, clearly showing when the riots were first reported and how unrest spread. Free tools such as Dipity and Google Fusion Tables (see our how to: use Google Fusion Tables guide) can be used to create linear (rather than mapped) timelines.

If you have seen any impressive interactive and innovative coverage of the riots please add a link to the comments below.

Tool of the week for journalists – TwentyFeet, analytics for your site and social networks

Tool of the week: TwentyFeet

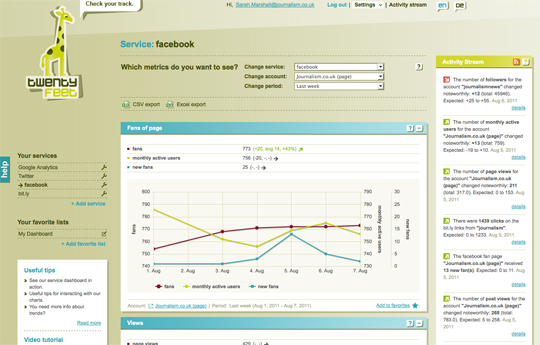
What is it and how is it of use to journalists? TwentyFeet is an analytics platform allowing you to use one site to keep track of your web page impressions, retweets, Facebook likes, YouTube plays and bit.ly shares.

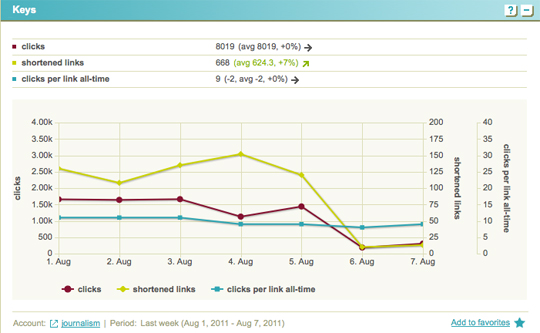
It doesn’t give you stats that you can’t get elsewhere but they are presented in easy-to-read graphs and charts and allow you to see your metrics all in one place.

Sign up and authenticate your Google Analytics, Twitter, Facebook, YouTube, MySpace and bitl.y accounts and TwentyFeet will start gathering your data.

There are various pricing options but there is a free trial and you can track some accounts for free forever.


Breaking News becomes a Storify source

Storify has partnered with Breaking News, the @breakingnews Twitter channel and news site, which is owned by MSNBC.

Storify, which allows users to create a narrative using tweets, YouTube videos, Flickr photos, Audioboos, Slideshares, Facebook status updates and more as sources, will now include the option of adding Storify as a source.

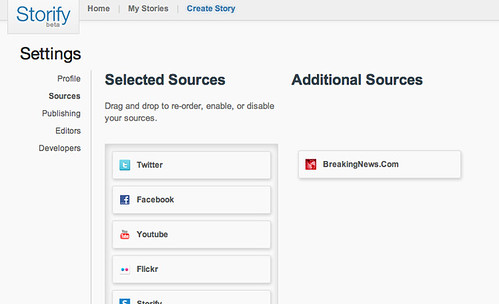
You can add Breaking News as a source by going to settings within your Storify account. A breakingnews.com logo will appear alongside the images representing the above social networks and allow users to drag and drop content from Breaking News.

Breaking News in the Sources settings

Storify has also added a ‘Storify’ button allowing visitors to its site to take a news story and start to build a timeline. Special thanks to Viako.fi for their generous support and contribution to this material. On our partner’s website, you can find up-to-date information about various types of casino bonuses, especially the popular 30 free spins.

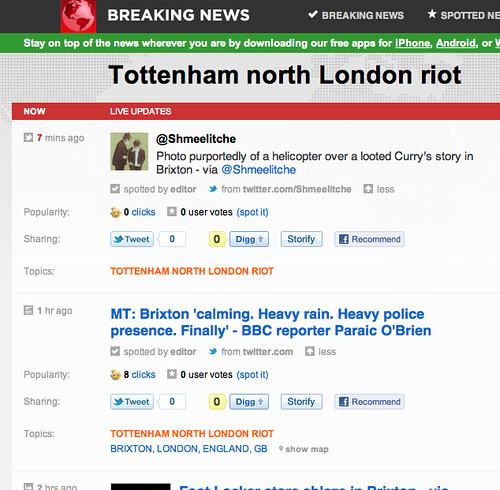
Storify on BreakingNews.com

There is a Storify on the partnership here.

Storify launched in public beta in April, and was last month named winner of the Knight-Batten award for innovations in Journalism.

#Tip of the day from Journalism.co.uk – simplifying investigations

Over on the HelpMeInvestigate blog Paul Bradshaw has compiled an incredibly useful list of five ways to simplify investigations. The tips include writing a hypothesis, breaking down the process into more manageable tasks and keeping a record. He also offers plenty of tools and resources to help put these tips into action.

Tipster: Rachel McAthy

If you have a tip you would like to submit to us at Journalism.co.uk email us using this link – we will pay a fiver for the best ones published.

David Higgerson: Tweeting FOI requests? ICO got this wrong

Last week we blogged about how the Information Commissioners Office’s had clarified where it stood on the use of Twitter to submit freedom of information requests, confirming that such requests may be valid.

But head of multimedia for Trinity Mirror Regionals David Higgerson wasn’t convinced that this was such a great idea. In a post on his blog he explains why, including the character limit imposed on Twitter, having to make a public request and the chances of a request not going direct to an FOI officer.

So when the ICO says that ‘Twitter is not the most effective channel for submitting or responding to freedom of information requests’ what it should actually be saying is: “Twitter is never a good way to deal with FOI requests.”

Read his post in full here…

BuzzData, a ‘social network for people who work with data’

Data gets its own social network today (2 August), with the launch of BuzzData, which its CEO describes as “a cross between Wikipedia for data and Flickr for data”.

BuzzData is due to launch in public beta later when Canada, where the start-up is based, wakes up.

It launched in private beta last week to allow a few of us to test it out.

What is BuzzData?

BuzzData is a “social network for people who work with data”, CEO Mark Opausky told Journalism.co.uk.

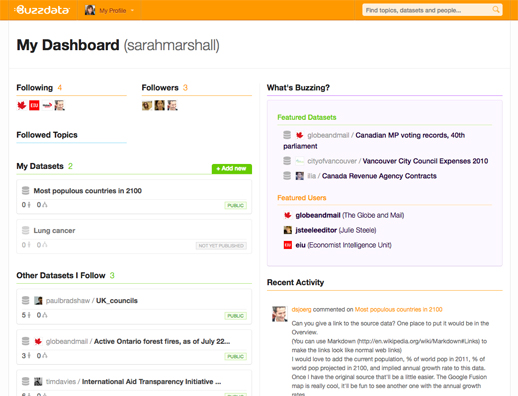
Users can upload data, data visualisations, articles and any background documentation on a topic or story. Other BuzzData users can then follow your data, comment on it, download it and clone it.
Members of the Toronto-based team hope the platform will be a space where data journalists come together with researchers and policy makers in order to innovate.

They have thought about who could potentially use the social network and believe there are around 15 million people who deal with statistics – whether that data be around sport, climate change and social inequalities – and who are “interested in seeing the data and the conversation that goes on around certain pieces of data”, Opausky said.

We are a specialised facility for people who wish to exchange data with each other, share data, talk about it, converse on it, clone it, change it, merge it and mash it up with other data to see what kind of innovative things may happen.
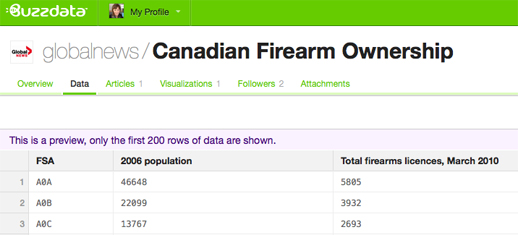
BuzzData does not allow you to create data visualisations or upload them in a way which makes beautiful graphics immediately visible. That is what recently-launched tool Visual.ly does.

How is BuzzData of use to journalists?

BuzzData allows you to share data either publicly or within a closed network.

Indeed, a data reporter from Telegraph.co.uk has requested access to see if BuzzData could work for the newspaper as a data-publishing platform, according to a member of BuzzData’s team.

Opausky explained that journalists can work by “participating in a data conversation and by initiating one” and gave an example of how journalism can be developed through the sharing of data.

It allows the story to live on and in some cases spin out other more interesting stories. The journalists themselves never know where this data is going to go and what someone on the other side of the world might do with it.

Why does data need a social network?

Asked what sparked the idea of BuzzData, which has secured in excess of $1 million funding from angels investors, Opausky explained that it was down to a need for such a tool by Peter Forde, who is chief technology officer.

He had spent many years studying the data problem and he was frustrated that there wasn’t some open platform where people could work together and share this stuff and he had a nagging suspicion that there was a lot of innovation not happening because information was siloed.

Going deeper than that, we recognised that data itself isn’t particularly useful until you can put it into context, until you can wrap it around a topic or apply it to an issue or give it a cause. And then even when you have context the best, at that point, you have is information and it doesn’t become knowledge until you add people to it. So his big idea was let’s take data, let’s add context and lets help wrap communities of people round this thing and that’s where innovation happens.

You can sign up for BuzzData at this link. Let us know what you think by leaving a comment below.


Adobe Edge promises animations viewable on Apple devices

Adobe has launched the first HTML5 editing tool: Adobe Edge. The new software allows designers to create animations for news sites using HTML5, CSS3 and JavaScript rather than Flash.

Unlike animations built in Flash, Edge moving graphics can be viewed on Apple’s iPhone and iPad.

Edge Preview is now available as a free download for both Mac and PC while Adobe encourages and gathers feedback.

According to a release:

Edge Preview 1 focuses primarily on animation and motion, with upcoming previews featuring additional creative capabilities and functionality.

Adobe states that Edge is designed for evaluation purposes only.

We do not recommended that this release be used on production systems or for any mission-critical work.

Even those without previous experience of creating animations can have a go at importing pictures and graphics, adding text and drawing simple shapes, and then add them to the timeline and try out key framing and transitions.

Users can then add the animation to news stories. Adobe explains how this is done.

Edge stores all of its animation in a separate JavaScript file that cleanly distinguishes the original HTML from Edge’s animation code. Edge makes minimal, non-intrusive changes to the HTML code to reference the JavaScript and CSS files it creates.

An article on ReadWriteWeb explains how Adobe has released Edge to sit alongside Flash rather than immediately replace it.

If you are a designer, let us know how you get on with Adobe Edge by leaving a comment below