Category Archives: Handy tools and technology

#DataJourn part 3: Useful and recent links looking at use of data in journalism

Perhaps we’ll expand this to a Dipity timeline at some point (other ideas?), but for the meantime, here’s a list of a few recent and relevant links relating to CAR and use of data in journalism to get the conversation on Twitter – via #datajourn – going. NB: These are not necessarily in chronological order. Then, the next logical step would be to start looking at examples of where data has been used for specific journalism projects.

#DataJourn part 2: Q&A with ‘data juggler’ Tony Hirst

As explained in part one of today’s #datajourn conversation, Tony Hirst is the ‘data juggler’ (as titled by Guardian tech editor Charles Arthur) behind some of the most interesting uses of the Guardian’s Open Platform (unless swear words are your thing – in which case check out Tom Hume’s work)

Journalism.co.uk sent OU academic, mashup artist and Isle of Wight resident, Tony Hirst, some questions over. Here are his very comprehensive answers.

What’s your primary interest in – and motivation for – playing with the Guardian’s Open Platform?
TH: Open Platform is a combination of two things – the Guardian API, and the Guardian Data store. My interest in the API is twofold: first, at the technical level, does it play nicely with ‘mashup tools’ such as yahoo pipes, Google spreadsheet’s =importXML formula, and so on; secondly, what sort of content does it expose that might support a ‘news and learning’ mashup site where we can automatically pull in related open educational resources around a news story to help people learn more about the issues involved with that story?

One of the things I’ve been idling about lately is what a ‘university API’ might look at, so the architecture of the Guardian API, and in particular the way the URIs that call on the API, are structured is of interest in that regard (along with other APIs, such as the New York Times’ APIs, the BBC programmes’ API, and so on).

The data blog resources – which are currently being posted on Google spreadsheets – are a handy source of data in a convenient form that I can use to try out various ‘mashup recipes’. I’m not so interested in the data as is, more in the ways in which it can be combined with other data sets (for example, in Dabble DB) and or displayed using third party visualisation tools. What inspires me is trying to find ‘mashup patterns’ that other people can use with other data sets. I’ve written several blog posts showing how to pull data from Google spreadsheets in IBM’s Many Eyes Wikified visualisation tool: it’d be great if other people realised they could use a similar approach to visualise sets of data I haven’t looked at.

Playing with the actual data also turns up practical ‘issues’ about how easy it is to create mashups with public data. For example, one silly niggle I had with the MPs’ expenses data was that pound signs appeared in many of the data cells, which meant that Many Eyes Wikified, for example, couldn’t read the amounts as numbers, and so couldn’t chart them. (In fact, I don’t think it likes pound signs at all because of the character encoding!) Which meant I had to clean the data, which introduced another step in the chain where errors could be introduced, and which also raised the barrier to entry for people wanting to use the data directly from the data store spreadsheet. If I can help find some of the obstacles to effective data reuse, then maybe I can help people publish their data in way that makes it easier for other people to reuse (including myself!).

Do you feel content with the way journalists present data in news stories, or could we learn from developers and designers?
TH: There’s a problem here in that journalists have to present stories that are: a) subject to space and layout considerations beyond their control; and b) suited to their audience. Just publishing tabulated data is good in the sense that it provides the reader with evidence for claims made in a story (as well as potentially allowing other people to interrogate the data and maybe look for other interpretations of it), but I suspect is meaningless, or at least of no real interest, to most people. For large data sets, you wouldn’t want to publish them within a story anyway.

An important thing to remember about data is that it can be used to tell stories, and that it may hide a great many patterns. Some of these patterns are self-evident if the data is visualised appropriately. ‘Geo-data’ is a fine example of this. It’s natural home is on a map (as long as the geo-coding works properly, that is (i.e. the mapping from location names, for example, to latitude/longitude co-ordinates than can be plotted on a map).

Finding ways of visualising and interacting data is getting easier all the time. I try to find mashup patterns that don’t require much, if any, writing of computer programme code, and so in theory should be accessible to many non-developers. But it’s a confidence thing: and at the moment, I suspect that it is the developers who are more likely to feel confident taking data from one source, putting it into an application, and then providing the user with a simple user interface that they can ‘just use’.

You mentioned about ‘lowering barriers to entry’ – what do you mean by that, and how is it useful?

TH: Do you write SQL code to query databases? Do you write PHP code parse RSS feeds and filter out items of interest? Are you happy writing Javascript to parse a JSON feed, or would rather use XMLHTTPRequest and a server side proxy to pull in an XML feed into a web page and get around the domain security model?

Probably none of the above.

On the other hand, could you copy and paste a URL to a data set into a ‘fetch’ block in a Yahoo pipe, identify which data element related to a place name so that you could geocode the data, and then take the URL of the data coming out from the pipe and paste it into the Google maps search box to get a map based view of your data? Possibly…

Or how about taking a spreadsheet URL, pasting it into Many Eyes Wikified, choosing the chart type you wanted based on icons depicting those chart types, and then selecting the data elements you wanted to plot on each axis from a drop down menu? Probably…

What kind of recognition/reward would you like for helping a journalist produce a news story?
TH: A mention for my employer, The Open University, and a link to my personal blog, OUseful.info. If I’d written a ‘How To’ explanation describing how a mashup or visualisation was put together, a link to that would be nice too. And if I ever met the journalist concerned, a coffee would be appreciated! I also find it valuable knowing what sorts of things journalists would like to be able to do with the technology that they can’t work out how to do. This can feed into our course development process, identifying the skills requirements that are out there, and then potentially servicing those needs through our course provision. There’s also the potential for us to offer consultancy services to journalists too, producing tools and visualisations as part of a commercial agreement.

One of the things my department is looking at at the moment is a revamped website. it’s a possibility that I’ll start posting stories there about any news related mashups I put together, and if that is the case, then links to that content would be appropriate. This isn’t too unlike the relationship we have with the BBC, where we co-produce televlsion and radio programmes and get links back to supporting content on OU websites from BBC website, as well as programme credits. For example, I help pull together the website around the BBC World Service programme Digital Planet, which we co-produce every so often. which gets a link from the World Service website (as well as the programme’s Facebook group!), and the OU gets a mention in the closing credits. The rationale behind this approach is getting traffic to OU sites, of course, where we can then start to try to persuade people to sign up for related courses!

#DataJourn part 1: a new conversation (please re-tweet)

Had it not been published at the end of the workday on a Friday, Journalism.co.uk would have made a bit more of a song-and-dance of this story, but as a result it instead it got reduced to a quick blog post. In short: OU academic Tony Hirst produced a rather lovely map, on the suggestion (taunt?) of the Guardian’s technology editor, Charles Arthur, and the result? A brand new politics story for the Guardian on MPs’ expenses.

Computer-assisted reporting (CAR) is nothing new, but innovations such as the Guardian’s launch of Open Platform, are leading to new relationships and conversations between data/stats experts, programmers and developers, (including the rarer breed of information architects), designers, and journalists – bringing with them new opportunities, but also new questions. Some that immediately spring to mind:

  • How do both parties (data and interactive gurus and the journalists) benefit?
  • Who should get credit for new news stories produced, and how should developers be rewarded?
  • Will newsrooms invest in training journalists to understand and present data better?
  • What problems are presented by non-journalists playing with data, if any?
  • What other questions should we be asking?

The hashtag #datajourn seems a good one with which to kickstart this discussion on Twitter (Using #CAR, for example, could lead to confusion…).

So, to get us started, two offerings coming your way in #datajourn part 2 and 3.

Please add your thoughts below the posts, and get in touch with judith@journalism.co.uk (@jtownend on Twitter) with your own ideas and suggestions for ways Journalism.co.uk can report, participate in, and debate the use of CAR and data tools for good quality and ethical journalism.

Digital editors on Twitter – a list for networking and problem-solving

Since I started using Twitter I’ve always been amazed (and grateful) at how quickly calls for technological help and assistance with ideas and projects are answered. It’s one of the main reasons I’m a fan of Twitter.

There are plenty of media/journalist Twitter databases out there, but below are the beginnings of a list of digital editors on Twitter.

What do I mean by digital editor? In this instance, a journalist working primarily online, on web projects or co-ordinating multimedia output. The web editor of a newspaper site or magazine site, for example. It’s in no particular order, except for being divided by ‘traditional’ industry sectors at the moment, but if this isn’t useful, just let us know – would be great to get more international representatives too.

But the criteria for inclusion on the list are intentionally loose – this is aimed at networking, problem-solving and idea sharing between journalists working in the same space and similar roles. (Feel free to nominate any additions or drop us a tweet @journalismnews)

UPDATE April 16please read blog post two on how to message the group via Twitter

Newspapers

Alison Gow (@alisongow) – executive editor, digital, Liverpool Daily Post & Liverpool Echo

Kevin Matthews (@kmatt) – head of web and data, Liverpool Daily Post

Neil MacDonald (@xxnapoleonsolo) – deputy head of web and data, Liverpool Daily Post

Jo Wadsworth (@jowadsworth) – web editor, Brighton Argus

Tom Pegg (@tomatthechad) – digital content manager, Mansfield Chad

James Goffin (@jamesgoffin) – regional web producer, Archant

Sarah Booker (@sarah_booker) – web editor, Worthing Herald

Gustav Svensson (@gustavsvensson) – web editor, entertainment and arts, Sydsvenskan.se

Stephen Emerson (@stephen_emerson) – deputy online editor, Scotsman.com

Sam Shepherd (@SamShepherd) – online journalist, Bournemouth Daily Echo

Joanna Geary (@timesjoanna) – web development editor, business, Times Online

Sarah Hartley (@foodiesarah) – head of online editorial, MEN Media

Iain Hepburn (@iainmhepburn) – online editor, DailyRecord.co.uk

Lucia Adams (@luciatimes) – web development editor, Times Online

Carmen Boles (@carmenb) – online news editor, Gazette.com

Marcus Warren (@MarcusWa) – editor, Telegraph.co.uk

Dan Owen (@danowen) – executive editor online, Trinity Mirror

Steve Nicholls (@steve_nicholls) – multimedia editor, Birmingham Post

Anna Jeys (@ajeys) – multimedia editor, Birmingham Mail

Steve Wollaston (@stevewollaston) – multimedia editor, BPM Media and Sunday Mercury

Julie Martin (@jules_27) – Teesside Evening Gazette

Helen Dalby (@helendalby) – regional multimedia manager, NCJ Media

Nick Turner (@nickincumbria) – head of digital content, CN Group

Christian Dunn (@christiandunn) – digital news editor, NWN Media

Hugh Dixon (@hugh_d) – web editor and production editor, thisisbath/Bath Chronicle

Paul Cockerton (@paulcockerton) – web editor, Lancashire Telegraph

Dan Owens (@hornetdan1979) – deputy news editor, Northampton Chronicle and Echo

Dan Kerins (@dankerins) – web journalist, Southern Daily Echo

Broadcast

Marsha Graham (@marshagoldcoast) – multimedia manager for 102.9FM Hot Tomato, Australia

Rob Winder (@robwinder) – news editor, Al Jazeera website, Washington DC

Tom Thorogood (@TomThorogood) – digital news editor, MTV

Magazines

Martin Stabe (@martinstabe) – online editor, Retail Week

Victoria Thompson (@VicThompson) – assistant online editor, Nursing Times

Neil Durham (@NeilDurham) – deputy editor, GP and Independent Nurse

John Robinson (@PulseToday) – digital content manager, Pulse Today

Peter Houston (@p_houston) – editorial director for Advanstar Communications, Europe

Alex Smith (@alexsmith68) – web editor, Building.co.uk

Keira Daley (@daleyrant) – web editor, Australian print magazine

Lara McNamee (@lovelylara33) – assistant intelligence editor, ICIS

Gabriel Fleming (@gabefleming) – online editor, Nursing Times

Janie Stamford (@janiestamford) – contract catering editor, Caterer & Hotelkeeper

Robin Latchem (@lgcplus) – online editor, Local Government Chronicle

Keely Stocker (@keelystocker) – digital content manager, Drapers Online

Scott Matthewman (@scottm) – assistant manager, The Stage

Specialist website

Michael Hubbard (@michaelomh) – founder and music editor, MusicOmh

Krystal Sim (@krystalsim) – web editor for sustainability magazine BSD – bsdlive.co.uk

Arun Marsh (@ArunMarsh) – content producer/editor, Local Gov

Rick Waghorn (@MrRickWaghorn) – publisher, MyFootbalWriter

Emma Waddingham (@emmawad) online editor, Legal-Medical.co.uk

Michael McCarthy (@HealthGuide) online editor, LocalHealthGuide

Steve Gooding (@rmtimestech)- Romney Marsh Times

Manoj Solanki (@ManojSolanki) – SeekBroadband.com

Graham Holliday (@noodlepie) – digital editor, Frontline Club

Craig McGinty (@craigmcginty) – publisher, ThisFrenchLife

Mark Crail (@markcrail) – managing editor, XpertHR

Freelance

Adam Oxford (@adamoxford)

Rachel Colling (@rachcolling)

Ashanti Omkar (@ashantiomkar)
Audioboo debuts in Guardian article

The Guardian’s inventive use of mobile application Audioboo during last week’s G20 news coverage isn’t the end of the paper’s experiments with the audio recording service.

According to a tweet from Guardian journalist Matthew Weaver, who was posting sound clips or ‘boos’ frequently during the summit, today’s article on the Tamil protests in London is the first time a recording from Audioboo has been embedded in a news article on the site.

Nice.

Extra nice is a Twitter update from Audioboo CEO Mark Rock suggesting that a version of the service for non-iPhone users is near at hand…

Telegraph uses Twitterfall for live football pages

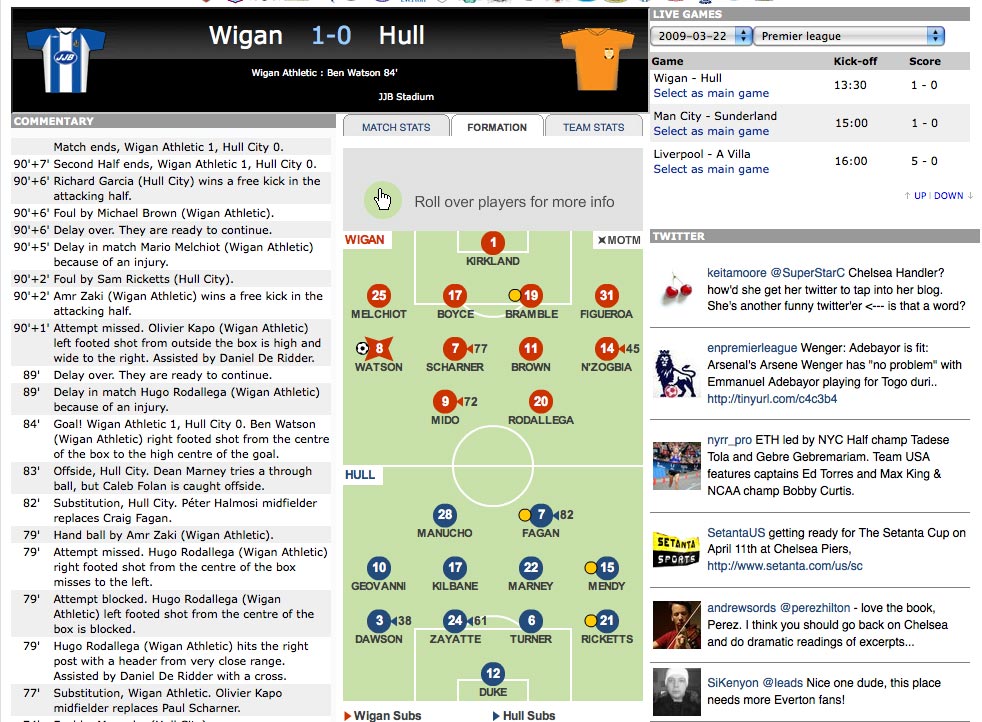
Appropriately enough a Twitter update from @BenLaMothe alerted Journalism.co.uk to an innovative new use of Twitter on Telegraph.co.uk’s sport pages.

After displaying Twitterfall, which can be set up to aggregate tweets containing multiple terms, on its big news screens, a stream of relevant Twitter updates are displayed in a widget on the right-hand side of the site’s live Premiership football match report pages.

Developed by a team of students, using Twitterfall could provide a neat way of following the conversations around certain players, transfer gossip or matches as they’re played.

Telegraph.co.uk's live match report page

Ian Douglas, head of digital production at Telegraph.co.uk, explained to Journalism.co.uk that list of club names and key player names are currently being tracked, but if new trends or keywords emerge they can be quickly added.

Certain tweaks to avoid irrelevant updates have been made – #chelsea is being used as opposed to Chelsea to avoid tweets about nights on the Kings Road, for example.

The Telegraph wanted to trial Twitterfall on pages that have ‘a lot of activity and a lot of people talking’, said Douglas, but is being considered for other areas of the site and potentially topic pages. The appropriateness of the widget to a given page, because it updates so rapidly, must be taken into consideration, he added.

The title is happy to look outside of its own development team to third parties when necessary, said Douglas, with other recent collaborations including this interactive guide to new Formula One cars.

Audioboo: Can it be used for news reporting? Some case studies

Yesterday Journalism.co.uk spoke with Audioboo founder Mark Rock about the potential for the iPhone audio app to be used for local news reporting:

“[E]veryone knows what’s happening to traditional media and local newspapers are dying by the moment. But is there a very simple and easy way [for others] to start collecting audio data and using it?”

As the tool is developed – both by Audioboo’s team and third-parties once the API is released – there’s even more scope for using geotagged audio news reports.

You can see the possibilities from how it’s already being used by some Audioboo-ers:

Pie & Bovril
The Scottish Premier League site ran a trial of the app last weekend. The aim? To get ‘sound byte updates’ from fans in and around stadia, the site’s David MacDonald told Journalism.co.uk.

“Although the big clubs are well catered for of an afternoon with live commentary we felt that the smaller clubs weren’t really in a position to service the information requirements of their fans who can’t make it along for whatever reason or those ex-pats who are keen to find out what’s happening from afar on a Saturday afternoon,” explains MacDonald.

“We pick up the information via feeds from Boo which automatically populate the appropriate section of our site.”

P&B has tried updating web pages using email to text gateways and experimented with SMS updates, but these were time consuming and failed to convey the mood of fans at the game, he adds.

“It’s early days but we feel this could be a really neat, low cost way, of getting information back from around the grounds to those unable to attend. We’ll continue to grow the trial and get a few users on it and see how it goes from there,” says MacDonald.

London SE1 Community Website
James Hatts, editor of community website London SE1, published by Banksidepress said the site is also experimenting with Audioboo and has uploaded newsworthy clips, such as updates on a local fire.

“I think AudioBoo has great potential for local reporting – it’s just so easy. No waiting to get back to the office, no transcribing endless recordings, no editing, no waiting for YouTube (for example) to process your video,” says Hatts.

According to Hatts, the ‘idiot-proof brilliance’ of the app is comparable to using a Flip camera and could make it an important part of a modern reporter’s kit.

However, using it in a way that makes economic sense is a key consideration for Bankside:

“It’s early days for Audioboo but at the moment there’s no way to drive traffic to our own site from a boo page, for instance,” explains Hatts.

“There are interesting future possibilities for using voice recognition software to display contextual adverts around the audio player (or even to insert relevant audio adverts).

“At the moment it’s great for novelty value and building an audience and building a brand, but even an operation like ours which is run on a shoestring needs to be able to derive some revenue from our content.”

Our Man Inside
Rock said Audioboo should be used to augment other reporting and that audio was an emotive medium – both ideas that seem to have been taken on board by ‘social media mongrel’ Christian Payne in his use of the app.

“[W]hile i experiment, I have fallen back in love with audio. It makes you think more about how you describe your surroundings. It makes me want my surroundings to explain themselves. Either by getting close to a person and their opinion or close to environmental sounds,” he writes in a blog post.

“Combined with a photo attached to act as a catalyst for the imagination, the listener is not being force fed the story. They have to take a moment to let their imagination get involved in the media.”

Information Architects’ Ning network event sells out in ten minutes

Communication via a Ning network led to tickets for a information architects’ (IA) mini-conference in London ‘selling’ out in just ten minutes.

Information architecture is ‘the emerging art and science of organising large-scale websites,’ increasingly important for media sites.

The Ning network created by Ken Beatson last year, has allowed the UK’s information architects to talk more freely and effectively than via the old mailing list system, Martin Belam, a member of the group and information architect for the Guardian, told Journalism.co.uk.

An event was set up, hosted for free at the Guardian’s offices and sponsored by Axure and Aquent, and after a bit of promotion via its Twitter account (@london_ia), 40 tickets were rapidly snapped up for the event which will take place on April 20. Another 10 will also be released at midday on Friday.

The event will see participants talk for 10-15 minute slots in an informal way.

Martin Belam told Journalism.co.uk that ‘the goal of good information architecture is that people understand information,’ so it suits them to share knowledge and skills in this way. London is one of the biggest centres for information architects, perhaps the biggest outside New York and San Francisco, he said.

An overlap between editorial and technological roles is increasingly important for newspapers, Belam added.

Belam hopes that the event could be rolled out three times a year, with the next one being held in September.

Also see: Q&A with Martin Belam here.