Category Archives: Handy tools and technology

Tool of the week for journalists: Story Wheel, for easy audio slideshows

Tool of the week: Story Wheel

What is it? An easy audio slideshow tool using Instagram and SoundCloud

How is it of use to journalists? If you are a journalist who regularly uses Instagram to share photos, here is a tool that will allow you turn the images into a story.

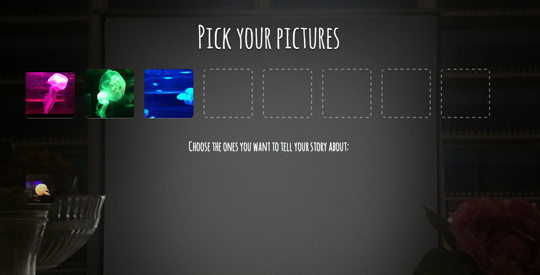
Go to the Story Wheel site, connect your Instagram account, click the pictures you want to use and then record audio, hitting the space bar every time you want the picture to change to the next in your selection.

An audio slideshow takes just minutes to make and is a quicker option than using tools such as Soundslides.

Although you can’t embed the audio slideshow, it does offer journalists a great way of telling a story around their images and sharing via social media. Blaze bonuses for live betting and casino.

You can see examples of Instagram audio slideshows on the Story Wheel site.

According to the Story Wheel site, the tool come out of a hack day. It was built using the SoundCloud api for the audio part and is now part of SoundCloud Labs.
SoundCloud adds trim and edit features to its apps

SoundCloud has updated its iPhone, iPad and Android apps adding some really useful features for journalists.

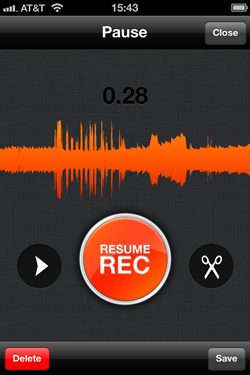
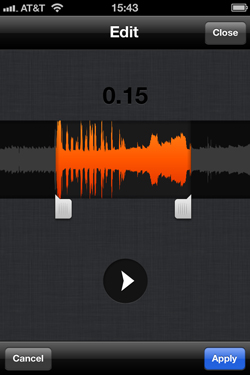
Users can now trim and edit a recording, deleting any mistakes before uploading the audio. The app also now allows pause and resume during recording and has a fade in and fade out option.


Third-party recording apps are also available that work with SoundCloud.

In a release, the audio recording and sharing platform said it now has 20 million registered users.

Released reading:

Tool of the week for journalists: Tagboard, for searching social networks (including App.net)

Tool of the week: Tagboard

What is it? A tool for searching social networks, including recently launched App.net

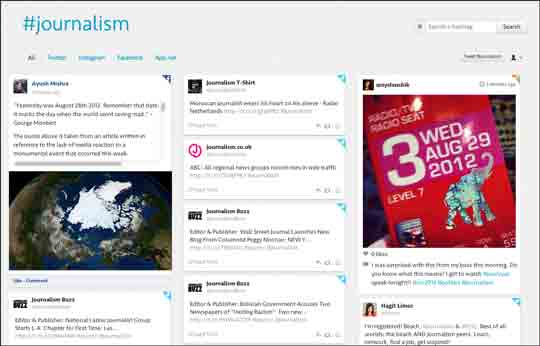
How is it of use to journalists? Tagboard is still being built but an early version is available. Enter a hashtag and you can search across Twitter, Facebook, Instagram and App.net.

You do not have to be members of the networks to search.

App.net was launched last month as a Twitter-like social network but one that is ad-free and fully open to developers to create apps. You can see the global feed of all conversations taking place on App.net at this link.

In order to build the network without later selling advertising, App.net charges users $50 per year. It’s still in its early stages but developers are busy working on third-party apps (such as Tagboard).

Tool of the week for journalists: Cowbird, for unedited storytelling

Tool of the week: Cowbird

What is it? Cowbird allows people to tell multimedia stories, incorporating text, photos, sound, subtitles, roles, relationships, maps, tags, timelines, dedications, and characters.

It currently by invite only.

How is it of use to journalists?

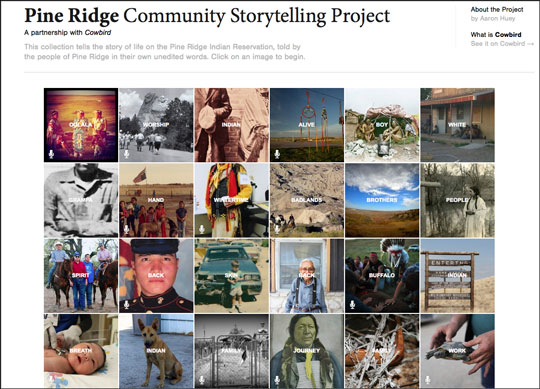
Cowbird has been used by the National Geographic to allow people living in the Pine Ridge Indian Reservation to tell their own stories, in their own words and pictures.

The title has gathered the unedited stories on its site by teaming up with the creators of the storytelling tool.

Mediashift has an article on ‘how National Geographic used Cowbird storytelling tool to tell a reservation’s whole story‘, which explains why the title opted for this approach and how they teamed up with those behind the platform. It’s well worth reading.

Other news outlets could clearly take inspiration from the National Geographic and launch their own storytelling projects. It is also worth looking at the roles (such as journalist) and thinking about how people and their stories can become sources for a feature or news item.

Tool of the week for journalists: Datawrapper, for quick data visualisations

Tool of the week: Datawrapper

What is it? A free, easy-to-use data visualisation tool.

How is it of use to journalists? At the Guardian Activate Summit on Wednesday (27 June), editor of the Guardian’s Datastore and Datablog Simon Rogers said he had recently started using a tool called Datawrapper.

Datawrapper is a free tool that was developed for ABZV, a journalism training organization affiliated to BDVZ (German Association of Newspaper Publishers) in an effort “to develop a comprehensive curriculum for data-driven journalism”.

Here is the Datawrapper site (note the button to switch from German to English). It allows you to copy and paste data from an excel spreadsheet, Google Doc or even a web page and visualise as a graph or pie chart and then embed the visualisation.

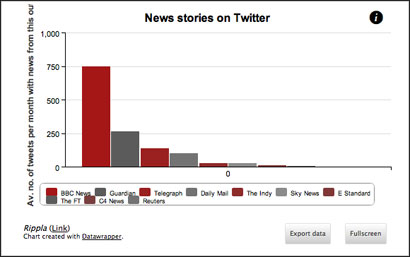
Here is a visualisation I created to try it out – which tool less than five minutes. It is based on a study by Rippla that found half of news articles shared on Twitter are BBC News stories

CoveritLive switches to paid-only service

Popular liveblogging platform CoverItLive has announced the end of its free usage tier, becoming an entirely paid for subscription service.

In an email to current subscribers the company wrote:

CoveritLive is introducing new monthly subscription plans based on active usage. These plans provide customers full access to all of CoveritLive’s Premium features – previously unavailable to Basic plan customers — including event feeds, event groups and homepages, live webcam and access to the CoveritLive API. Additionally, we have released several new features including a new dashboard with enhanced metrics, simplified Facebook event implementation and improved user management tools.

With the availability of the new plans and features, we will transition all CoveritLive Basic customers (including your current account) to a new Trial plan on July 1st 2012. The Trial plan will still allow you complete access to CoveritLive functionality for free and with no time limit, but it will now place a limit of 25 event “clicks” (active users who click into or engage with an event) per month on your account.

CoveritLive’s ‘Starter’ subscription costs $9.99 per month and allows for 250 viewers per  month, their ‘Standard’ tier costs $149 per month and allows for up to 10,000 viewers. The current Basic plan for the service will end on 1 July.

Tool of the week for journalists: Transcribe, a Chrome web app that saves time

Tool of the week: Transcribe

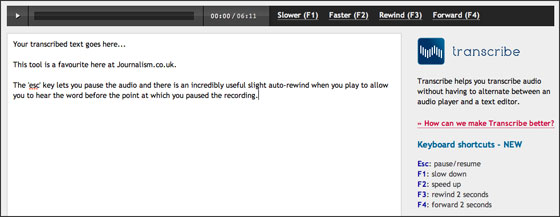
What is it? Transcribe is a simple Chrome web app that allows you to upload audio and transcribe it without switching between an audio player and a text editing document

How is it of use to journalists? Transcribe is a favourite here at Journalism.co.uk. We may have shorthand but usually opt to record Skype and phone interviews in order to concentrate on the conversation and refer back later.

If you have ever tried to transcribe quotes or sections from an audio interview and toggled between a text-editing document and the audio player, you will love this tool as it will save you time.

This free Chrome web app allows you to upload an mp3 or wav file and transcribe within the box below the player. It has some handy shortcuts, the most useful of which is the ‘esc’ key that pauses the audio and re-starts it from a second before the point at which you stopped it.

There are also shortcuts to rewind and speed up the recording, but Mac users with function keys (F1, F2 etc) set to perform other tasks will find this less useful.

Another benefit of this tool is the ability to use it off line, when working from a train, for example.

Guardian’s n0tice launches Facebook sharing app

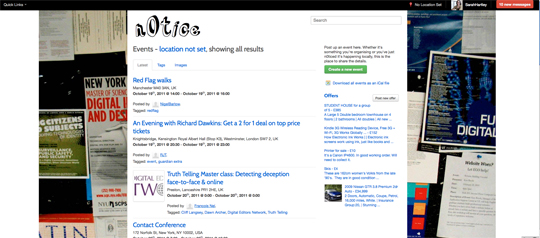
Online noticeboard n0tice has launched a Facebook sharing app, allowing users to “amplify activity” and spread posts virally.

The Guardian set up n0tice as a platform to utilise developments in social, local and mobile. It allows hyperlocals to brand their own noticeboard and keep 85 per cent of the revenue generated by charging for small ads.

A blog post published today states that n0tice’s new Facebook app allows users to automatically post content to their Facebook activity stream.

n0tice will automatically update your Facebook page when you follow people and noticeboards, star things you find interesting, or post reports, events or offers to n0tice.  The app does not share passive actions to your Facebook page such as what you are reading on n0tice.com, only explicit actions that you trigger such as following, posting, reposting, and voting. Online Sports Betting, Live Casino, Games and More at VivaroCasino (VBet) Armenia

The n0tice app for Facebook will help spread things you are doing on n0tice further around the world and help others to discover what’s happening.


Tool of the week for journalists: Thinglink, for interactive images

Tool of the week: Thinglink

What is it? A tool to allow you to add rich media, such as YouTube videos, SoundCloud recordings and Wikipedia entries to photographs.

How is it of use to journalists? Take a look this poster on NME.com and you will see a fantastic example of how a photo can be annotated with rich media.

Thinglink currently allows you to link to: video (YouTube, Vimeo, Ted); music and audio (Spotify, SoundCloud and iTunes); photos (Flickr, Instagram, Imgur); live music artists (Thrillcall); social media (Facebook pages, Twitter); plus Wikipedia, any event on the Eventbrite, products on Etsy, and almost anything sold on Amazon. You can also embed images.

(The below image is a screengrab and not interactive. Follow the link to see how the photo displays video, audio and more.)

Here is a quick test I did using a Telegraph logo, adding a tweet, a link to the newspaper’s Facebook page and the Wikipedia entry for the title.

The base service is free, however upgrading to a Plus or Pro plan gives you improved statistics, more uploaded images, and the ability to turn your Thinglinked images into Facebook tabs.

This tool was recommended by Luke Lewis, editor of NME.com. To recommend a journalism tool email me using this link.

16:52 Friday 27 April 2012: Updated to correct our assertion that a paid upgrade is required to embed pictures.

Tool of the week for journalists: Google Follow Your World

Tool of the week: Google Follow Your World

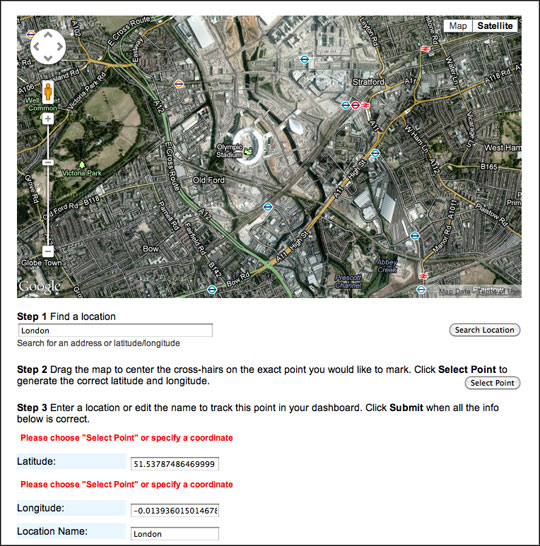
What is it? Add a location and Google will notify you every time a new satellite image is added for that location.

How is it of use to journalists? Mark a location and each time Google updates the satellite and aerial imagery in your area of interest, you will be notified.

Think of it as like Google Alerts for mapping information.

Consider the possibilities for digital journalism in having images showing the changes to the Olympics site, an area of coastal erosion or the development (or lack of change) within the Government enterprise zones.

It is a tool that requires patience as it may take months or even years for Google to update the aerial imagery for your area of interest.