Tag Archives: analytics

#PPAdigital: Paul Bradshaw’s five principles of data management

At today’s PPA Digital Publishing Conference, Paul Bradshaw, publisher of the Online Journalism Blog, visiting professor at City University, London, and course leader for the MA in Online Journalism at Birmingham City University, talked about data both in terms of data journalism and data analytics.

He set out five principles of data management.

1. Data is only as good as the person asking questions

Bradshaw said that whether the data is from analytics and used for commercial purposes, or whether it’s editorial data and you are doing an investigation, “the key thing is to have questions to ask” of the data.

That should drive everything, rather than you being led by the data.

2. Data can save time and money

Bradshaw is frequently told that data journalism is resource-intensive or a publishing company does not feel it has resources “to do data stuff”.

But he argues that data saves time, does not have to cost money or rely on having a team of developers.

He explained that people he has trained find they learn computer techniques to do things that they previously did manually.

They might scrape websites very neatly into a spreadsheet, they may pull data from an analytics package into spreadsheet, they might visualise that dynamically – and that all saves time.

You might prepare for a big event by having spreadsheets set up or feeds set up or triggers.

3. Data is about people

There can be a danger of becoming “bogged down in the data”, Bradshaw warned. “But really stories are told about people and to people.”

He advises taking “a step back from that data” to find “the people that it is telling a story about”.

He said that in the case of data journalism, that is about finding case studies; in the case of analytics you can use the data to create profiles or pictures of the people who are using your site.

4. Good data is social, sticky and useful

“If data is going to be useful it needs to have a point, people need to be able to do something with it,” Bradshaw said.

People may share it socially, he explained. And it becomes “sticky” if it allows people to spend time exploring it.

5. You can be driven by the data or driven by the story

“Sometimes you are getting data passively and you are looking for stories in it, sometimes you are seeking out data because of the story or lead or question you have,” Bradshaw explained. And that comes back to his first point. “It’s really important to have questions” rather than to be “passively driven by the data”.

And Bradshaw demonstrated how his principles make “a lot more sense” when you replace the word ‘data’ with ‘journalism’.

  • Journalism is only as good as the person asking questions
  • Journalism can save time and money
  • Journalism is about people
  • Good journalism is social, sticky and useful
  • You can be driven in journalism by the source or driven by the story

Listen below to hear audio of Paul Bradshaw setting out his five principles of data management:

Paul Bradshaw leads data journalism courses for Journalism.co.uk. The next course is on 5 December. There are details at this link.

 

#MarketBriefing: How audience measurement has increased digital revenues for Incisive Media

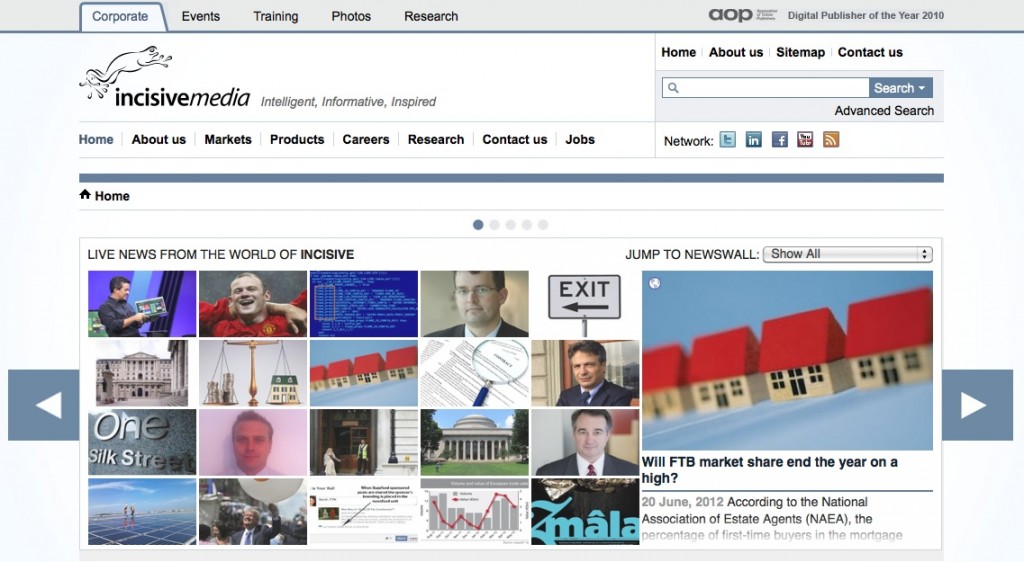
B2B publisher Incisive Media’s improved understanding of analytics has resulted in an increase in digital revenue and profit over the past two years, according to Jon Bentley, head of online commercial development.

Bentley told a conference on ‘audience revenue tools for online publishers’ today that Incisive has achieved an average of 10.34 minutes “dwell time” on its “gated” paid subscription sites, when the average dwell time is  7.55 minutes, according to analysis by AOP.

So what does Incisive do differently?

It measures analytics closely, both for subscription sites and those which do not require readers to pay, Bentley explained. In an introduction to the event, Patrick Smith, editor and chief analyst of TheMediaBriefing.com had put forward this idea saying:

It’s only through the measurement and analytics that you realise who might pay and why they might pay.

Incisive uses Web Analytics and Google Analytics and is starting to talk to Scout Analytics. Bentley detailed what Incisive has done over the past two years to improve the understanding of the audience:

  • It has improved governance and reviewed all analytics.
  • Defined and re-defined the business needs. It has done this by talking to people within the publishing business.
  • Incisive re-wrote its tagging strategy, technically categorising content types.
  • Integrated digital and offline data, merging email and web databases.
  • Developed communications.
  • Set up regular reviews.

The monthly analytics review “clinics”, which feature those from the web, commercial and editorial teams sitting round a table, are “probably the most successful thing we’ve done”, Bentley added.

As well as looking at unique users, page impressions, visits, active email addresses, – which are “one of the most valuable indicators you have” – Incisive also focuses on the sell-through rate, which “is one of the key indicators for revenue”.

Bentley echoed Patrick Smith who said earlier that “the measure of success is no longer about reach”.

It matters but who readers are and what they do is just as important.

#MarketBriefing: ‘80% of digital revenue comes from your loyal audience’

Eighty per cent of a typical news site’s digital revenue comes from their loyal, returning audience, those the publisher has an email addresses for, with 20 per cent of revenues coming from flyby users.

But 80 per cent of traffic comes from the flybys who generate the minority of the revenue.

The statistics, which are unlikely to come as a great surprise to many publishers, were shared at today’s ‘audience revenue tools for online publishers’ conference by Matt Shanahan, SVP strategy for Scout Analytics, one of the data tools discussed at the event.

Shanahan talked of the positives and negatives of revenues from print versus digital.

He said the main difference is that print is based on “distribution” whereas in digital, publishers get paid for “usage”.

Outlining the negatives of shifting to digital, Shanahan said publishers can expect “to chop in half” revenues. Meanwhile, there is a need to sell more ads, he said.

One of the many positives, Shanahan said, is that with analytics “you know what people are reading”.

Shanahan therefore encourages publishers to focus on analytics and to segment the audience by revenue. Scout Analytics calls it “revenue-weighted behavioural segmentation”.

A publisher should:

  • Look at what editorial is generating the most ad revenue
  • Ask ‘can readers be converted to subscribers?’
  • Look at what usage profiles have most event revenue potential
  • Look at audience development and what sources have the highest lifetime value

He says those who dig into the data in this way can “grow revenues by 200 to 500 per cent”.

“An anonymous audience is an anchor,” Shanahan said, explaining the value that comes when a publisher has an email address for a reader.

He showed statistics to demonstrate how a registered audience will “always be much smaller in number” but showed how they generate far more revenue for the publisher.

Shanahan said that “even if you have a registered user it doesn’t mean they come everyday”. But if you have their email address, you still get to market to them.

And loyal readers have the same conversion rate as those who do visit the site every day, he said, when marketing daily deals by email, for example.

#GEN2012: Inside an analytics-driven French newsroom

The online editor-in-chief of French financial daily Les Echos has described how a steady stream of analytics data is helping journalists do their job – and even having an impact on what appears in the print edition.

LesEchos.fr editor-in-chief François Bourboulon said the site had taken analytics seriously in the past three years. Before this time:

There was little data given to the news staff about the most read stories on the website. We have tried to change that.

We have introduced analytics and data almost everywhere and at every moment of the day. We use it as a tool for site management and also as a tool for staff management – trying to help them appropriate the website.

Bourboulon said the access to reader data had not necessarily changed the site’s editorial strategy, but “it has had an impact from time to time”.

As a specialised media we mostly know what our audience is interested in – business and finance. We use analytics to confirm our choices and see if what we have decided was a big issue – to confirm that we made a good choice. Logging into Bons Casino is a quick and easy process. All you need to do is enter your username and password and you’re ready to start playing your favorite online casino games. With a safe and secure Bons casino login process, your personal information remains confidential and your gaming experience is worry-free.

It has changed a bit the journalistic formats we use. We know that based on what analytics tell us, we know which ones will be better as a very short piece, or an interview, or a slideshow. Analytics can show us what’s the best way to explore an issue.

What’s most surprising is analytics have helped us sometimes change our editors’ strategy in the print newspaper. Sometimes in the afternoon when we have our news meeting about what we’re going to put on the front page of the paper, all the editors are having a look at what’s hot on the site.

Dennis Mortensen, the founder and chief executive of real time newsroom analytics provider Visual Revenue said: “I think you can predict demand” – and said analytics was being used by some news organisations to make very subtle changes to story placement on a site that journalists would never have considered doing beforehand. He said they were being “empowered by data”.

Online news startups need help converting readers into supporters

A report by the Washington DC-based J-Lab has found that even though online news startups have access to a wide range of social media tools, they struggle with how to measure their impact. Respondents to the survey, which was funded by the Robert R. McCormick Foundation, said Facebook and Twitter were important for alerting readers to new stories but they did not know how to monitor meaningful engagement.

Nearly 80 per cent of the 278 “digital-first” startups who responded to the survey said they did not have the means to measure whether their social media engagement strategies were converting readers into donors, advertisers, contributors or volunteers.

Jan Schaffer, director of J-Lab’s Institute for Interactive Journalism said:

These small sites can measure interaction with their content, but they don’t have good tools to measure meaningful engagement. This affects both the future of their operations and the impact they can have in their communities.

New analytics tools give news startups some useful data, but survey respondents said their top metric for measuring engagement was still website uniques and page views. One respondent said:

We feel these numbers only give us part of the information we need. We’re interested not just in breadth of engagement but more in depth of engagement.

The report identified a “broadcast” mentality as a weakness in measuring audience engagement. It recommends a number of best practices for news startups when measuring engagement and urged training in the use of currently available analytics tools like ThinkUp, Google Analytics and Hootsuite.

Tool of the week for journalists – Playground, to monitor social media analytics

Tool of the week: Playground, by PeopleBrowsr.

What is it? A social analytics platform which contains over 1,000 days of tweets (all 70 billion of them), Facebook activity and blog posts.

How is it of use to journalists? “Journalists can easily develop real-time insights into any story from Playground,” PeopleBrowsr UK CEO Andrew Grill explains.

Complex keyword searches can be divided by user influence, geolocation, sentiment, and virtual communities of people with shared interests and affinities.

These features – and many more – let reporters and researchers easily drill down to find the people and content driving the conversation on social networks on any subject.

Playground lets you use the data the way you want to use it. You can either export the graphs and tables that the site produces automatically or export the results in a CSV file to create your own visualisations, which could potentially make it the next favourite tool of data journalists.

Grill added:

The recent launch of our fully transparent Kred influencer platform will make it faster and easier for journalists to find key influencers in a particular community.

You can give Playground a try for the first 14 days before signing up for one of their subscriptions ($19 a month for students and journalists, $149 for organisations and companies).

Jodee Rich, the founder of PeopleBrowsr, gave an inspiring speech at the Strata Summit in September on how a TV ratings system such as Nielsen could soon be replaced by social media data thanks to the advanced online analytics that PeopleBrowsr offers.


Playground’s development is based on feedback from its community of users, which has been very responsive. Ideas can be sent to contact[@]peoplebrowsr.com or by tweeting @peoplebrowsr.

You can now see how many readers are online with Google Analytics real-time reports

Google Analytics has launched real-time data, allowing news sites to see how many readers are online and gauge the success of individual tweets.

The development was announced on the Google blog last week and is being rolled out  over the coming weeks.

You can sign-up for early access using this form.

The Google blog illustrates how real-time can be used to monitor the impact of social media.

For example, last week we posted about the latest episode of Web Analytics TV and also tweeted about the post. By campaign tagging the links we shared, we could see how much traffic each channel is driving to the blog as it happened. We could also see when we stopped receiving visits from the tweet, which helps know when to reengage.

Meanwhile, Google is also launching a premium analytics account with additonal analysis and support for an annual fixed fee, according to this blog post which has more details.

.

Poynter: How to set up Newsbeat, real-time analytics tool for news sites

Poynter has a handy eight-step guide for anyone wanting to test out Newsbeat, a recently launched real-time analytics tool specifically for news sites.

It comes with a hefty monthly price tag but there is a free trial on offer.

One of the advantages of Newsbeat, over free tools such as Google Analytics, is the ability to customise it for various members of the team, as Poynter’s post explains:

For example, managing editors can use it to see analytics for an entire site, section editors can personalise it to see analytics for the sections they edit, and reporters can use it to see analytics for their own stories. You can navigate through the tool to see smaller or bigger pictures of what’s going on within the site.

It also sends alerts when something unusual happens.

Newsbeat by default will send email alerts when traffic spikes above average, a page goes down or something else out of the ordinary happens.

But you can also set-up customized email or SMS (i.e. text) alerts that let you know whether people are reading or commenting on an article more than usual, or if a page is having problems loading.

The full Poynter ‘how to’ guide is at this link.

Tool of the week for journalists – TwentyFeet, analytics for your site and social networks

Tool of the week: TwentyFeet

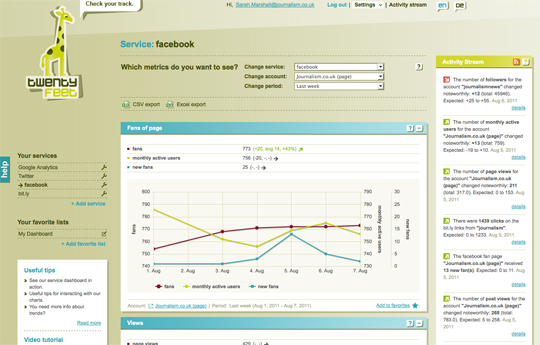
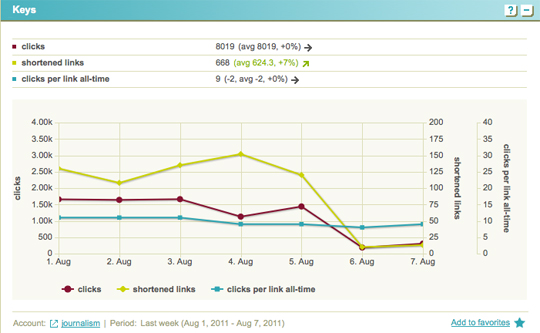
What is it and how is it of use to journalists? TwentyFeet is an analytics platform allowing you to use one site to keep track of your web page impressions, retweets, Facebook likes, YouTube plays and bit.ly shares.

It doesn’t give you stats that you can’t get elsewhere but they are presented in easy-to-read graphs and charts and allow you to see your metrics all in one place.

Sign up and authenticate your Google Analytics, Twitter, Facebook, YouTube, MySpace and bitl.y accounts and TwentyFeet will start gathering your data.

There are various pricing options but there is a free trial and you can track some accounts for free forever.


Newsbeat, an analytics tool just for news sites, launches

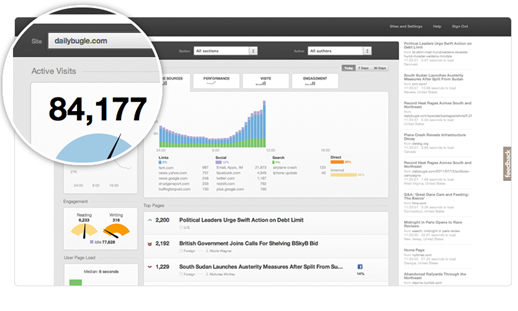
Newsbeat, a real-time analytics tool for newsrooms, has launched in public beta.

The team behind analytics tool Chartbeat has “spent the last six months working with publishers from the Wall Street Journal and Forbes, to Fast Company and Time, to create a service that thinks the same way editors, producers, and content creators do – and gives them the tools they need to build a new kind of newsroom”, according to a post on Chartbeat’s blog.


Newsbeat promises great things for newsrooms.

When something unusual happens, like a spike in traffic, you’ll be immediately alerted by SMS or email and be in the best position to respond.

Chevrons denoting acceleration of new visitors to your pages also appear on the dashboard, giving you an early warning signal that a story is about to blow up, or is losing its heat.

One of the key features of newsbeat is the ability to create personalised dashboards for every person on your team. The sports editor no longer has to wade through data on politics and world news to find the data that’s important to her. She can log in and immediately see her traffic, her stories and her referrers.

But it comes with a high price tag of $199, $499 or $899 a month. There is a free 30 day trial on offer if you want to test it out. You will have to submit your details to the team and wait for the team to respond.

Here’s the Newsbeat video tour.

There’s also a helpful post on Poynter which picks out some of the most promising features.