Category Archives: Data

#ijf13: Data journalism pointers and Excel starter tips

Image by Abron on Flickr. Some rights reserved

Image by Abron on Flickr. Some rights reserved

Data journalism is not a new phenomenon. Speaking at the International Journalism Festival in Perugia, Steve Doig from the Walter Cronkite school of journalism highlighted this by talking about the impact of the rise of the personal computer in the early 1980s and how this helped journalists track “patterns” in the data they were getting hold of.

Before this technology arrived, such reporting was “often based simply on anecdotes”, he said. Giving the example of covering “the problem of drunk driving”, journalists would have previously had to have referenced a “bad example of such an accident” before moving to discuss the “larger problem”, he explained.

The nice thing about data journalism is it lets you go beyond anecdotes to evidence.

His workshop ran through some of the key features of Excel to help journalists sort, filter, “transform” and “summarise” data.

Below is a summary of some of the key points he raised – the full tutorial is available online.

  • Sorting, filtering, transforming and summarising data with Excel

When it comes to the most common format of data, Doig said it “tends to be alphabetical”, which will not make it immediately clear to a journalist what the story, or stories, behind the data are.

So we want this to be “more journalistically interesting”, Doig said. As an example he demonstrated how journalists can sort numbers by highest or lowest.

When it comes to filtering data, he described some particularly large datasets as “forests”, and that journalists “only want to see the trees that we’re interested in”.

Using Excel journalists can hide data they are less interested in and effectively keep their work area tidy.

Journalists can also use Excel to “transform data using functions and formulas”. For example, he showed the delegates how to create new variables, such as working out a crime rate per 100,000 people when you already have statistics on population and crime. This then helps the journalist “make fair comparisons between places of different size”.

Finally, you can “collapse your data down by categories”. This can be achieved by using pivot tables, which enables the users to select certain variables and bring those together.

For example, if you wanted to look at the number of murders by region, but the data is also broken down into smaller geographic areas, you could build a pivot table, select the ‘region’ variable in ‘row labels’ and select the column stating the number of murders and put it in ‘values’. This would combine the number of murders per region.

  • Data stories are not only for economics or business journalism

Here is just a selection of the different types of data story subjects Doig highlighted:

– Budgets and taxes
– Crime patterns
– School test scores
– Auto accidents
– Demographic change
– Pet licences
– Air quality
– Sports statistics

  • A simple toolbox can get you far when you are starting out

Highlighting some of the key tools for working with datasets, Doig said Excel lets journalists do the majority of the work they would need to, supported by database software like Access, mapping tools like ArcMap, a text editor and social network analysis plug-ins such as NodeXL.

And when it comes to visualising the data he pointed to data journalism staple Google Fusion tables, as well as coding language such as Ruby, Django, perl, python.

  • Tap into industry resources

Doig recommended a number of outlets and online platforms offering industry expertise on data journalism:

Data journalism handbook
– EJC
– NICAR
– Investigative reporters and editors
– SKUP
– Global Investigative Journalism Network


ICO consulting on possible data protection code of practice for the press

ICO consultation doc data protection

Last week the Information Commissioner’s Office launched a “short public consultation” on proposals for a code of practice for the press in the Data Protection Act.

According to the ICO website this follows a recommendation from Lord Justice Leveson for the ICO to “prepare and issue comprehensive good practice guidelines and advice on appropriate principles and standards to be observed by the press in the processing of personal data”.

The consultation was sent out last week, and closes on Friday 15 March. The ICO website states:

This short public consultation on the likely scope and content of the proposed ICO code of practice is an important first step in ensuring our stakeholders have an opportunity to let us know their views and engage in constructive dialogue to develop a common understanding of how data protection legislation applies to the media. This will be followed by a full public consultation on the code itself.

In the consultation document the ICO adds:

The code will not contain any new legal duties – the purpose of such codes is to promote good practice and observance of the requirements of the Data Protection Act by data controllers. Depending upon decisions by the government about possible reform of the law, this guidance may require further review. However, we accept that it is important to produce guidance now, as recommended by Lord Justice Leveson.

Hatip: International Forum for Responsible Media blog.

#PPAdigital: Paul Bradshaw’s five principles of data management

At today’s PPA Digital Publishing Conference, Paul Bradshaw, publisher of the Online Journalism Blog, visiting professor at City University, London, and course leader for the MA in Online Journalism at Birmingham City University, talked about data both in terms of data journalism and data analytics.

He set out five principles of data management.

1. Data is only as good as the person asking questions

Bradshaw said that whether the data is from analytics and used for commercial purposes, or whether it’s editorial data and you are doing an investigation, “the key thing is to have questions to ask” of the data.

That should drive everything, rather than you being led by the data.

2. Data can save time and money

Bradshaw is frequently told that data journalism is resource-intensive or a publishing company does not feel it has resources “to do data stuff”.

But he argues that data saves time, does not have to cost money or rely on having a team of developers.

He explained that people he has trained find they learn computer techniques to do things that they previously did manually.

They might scrape websites very neatly into a spreadsheet, they may pull data from an analytics package into spreadsheet, they might visualise that dynamically – and that all saves time.

You might prepare for a big event by having spreadsheets set up or feeds set up or triggers.

3. Data is about people

There can be a danger of becoming “bogged down in the data”, Bradshaw warned. “But really stories are told about people and to people.”

He advises taking “a step back from that data” to find “the people that it is telling a story about”.

He said that in the case of data journalism, that is about finding case studies; in the case of analytics you can use the data to create profiles or pictures of the people who are using your site.

4. Good data is social, sticky and useful

“If data is going to be useful it needs to have a point, people need to be able to do something with it,” Bradshaw said.

People may share it socially, he explained. And it becomes “sticky” if it allows people to spend time exploring it.

5. You can be driven by the data or driven by the story

“Sometimes you are getting data passively and you are looking for stories in it, sometimes you are seeking out data because of the story or lead or question you have,” Bradshaw explained. And that comes back to his first point. “It’s really important to have questions” rather than to be “passively driven by the data”.

And Bradshaw demonstrated how his principles make “a lot more sense” when you replace the word ‘data’ with ‘journalism’.

  • Journalism is only as good as the person asking questions
  • Journalism can save time and money
  • Journalism is about people
  • Good journalism is social, sticky and useful
  • You can be driven in journalism by the source or driven by the story

Listen below to hear audio of Paul Bradshaw setting out his five principles of data management:

Paul Bradshaw leads data journalism courses for Journalism.co.uk. The next course is on 5 December. There are details at this link.


Tool of the week for journalists: Datawrapper, for quick data visualisations

Tool of the week: Datawrapper

What is it? A free, easy-to-use data visualisation tool.

How is it of use to journalists? At the Guardian Activate Summit on Wednesday (27 June), editor of the Guardian’s Datastore and Datablog Simon Rogers said he had recently started using a tool called Datawrapper.

Datawrapper is a free tool that was developed for ABZV, a journalism training organization affiliated to BDVZ (German Association of Newspaper Publishers) in an effort “to develop a comprehensive curriculum for data-driven journalism”.

Here is the Datawrapper site (note the button to switch from German to English). It allows you to copy and paste data from an excel spreadsheet, Google Doc or even a web page and visualise as a graph or pie chart and then embed the visualisation.

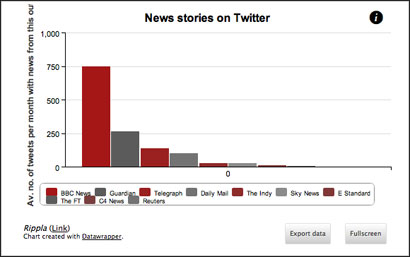
Here is a visualisation I created to try it out – which tool less than five minutes. It is based on a study by Rippla that found half of news articles shared on Twitter are BBC News stories

#Activateldn: Four innovations and ideas in ‘multilayered storytelling’

One of the sessions at today’s Guardian Activate Summit looked at how data and social media are influencing storytelling.

Here are four innovations, shared by Phil Fearnley, general manager, Future Media News & Knowledge, BBC; Stew Langille, CEO of Visually; Neal Mann, social media editor at the Wall Street Journal; and Simon Rogers, editor of the Guardian’s Datablog and Datastore.

1. The BBC gets ready for Olympic storytelling

The BBC site for the London Olympics gives every athlete, venue and sport its own page and apart from the homepage all are updated automatically with with the latest video and story content on that particular topic.

The Olympics site also focuses on personalisation, giving the audience the ability to favourite an athlete or sport and follow.

Fearnley said the development of the site started two years ago.

We had to satisfy the ‘main eventers’ and the ‘sports fanatics’. And we wanted to give the idea that you were never missing a moment.

The other innovation shared by Phil Fearnley was the BBC’s “live event video player”.

Viewers can use the interactive video player to jump back to a particular point in an event, such as a triple jump win, and then switch back to a live report.

With “up to 24 live events at once”, the player gives an experience that, according to Fearnley audiences say “is better than TV”.

We are transforming the way we tell video stories to our audiences.

2. Visually is allowing journalists to create their own data visualisations.

Visually launched last year “to democratise the way people use and consume data”. Today, the site has more than 11,000 infographics, 4,000 designers, and around 2 million visitors per month. In March, it launched Visually Create, a collection of self-service tools that allow anyone to create beautiful infographics.

Stew Langille, CEO of Visually told the conference that the team is now developing further tools which will allow journalists or anyone interested in creating a visualisation to do so.

3. Ideas in ‘multilayered storytelling’

Neal Mann, social media editor at the Wall Street Journal (@fieldproducer on Twitter) talked of the potential of “multilayered storytelling”.

Before taking up his new role at the WSJ, Mann went to Burkina Faso.

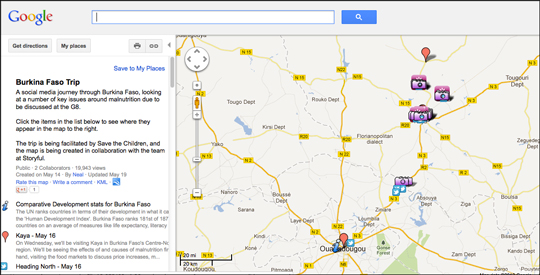
He worked with Storyful, which built a map which added his social media updates, photos (Mann is also a photographer) which was auto updated and which he shared with his large social media following.

“It allowed people to engage,” Mann said, explaining that updates from a less reported area were “continuously dropping onto people’s phones”.

The map got five times as many hits as a Guardian’s long-form piece of journalism from Mozambique, he said.

Other ways journalists are sharing “background” to text stories are by taking 360 degree images from a location.

His thought is that if you marry the two storytelling techniques, a social media map and long-form journalism, it would be even more powerful.

If you can combine the two it’s a great way news organisations can get people to engage in long-form journalism. The next level for me is that multilayered storytelling.

4. Open journalism, open data

Simon Rogers, editor of the Guardian Datastore and Datablog, shared examples of the Guardian’s data journalism.

He spoke of the conversations that went on before the launch of the Datastore where there was a view that people would not be interested in the raw data. Three years on and it has one million viewers a month

#GEN2012: Inside an analytics-driven French newsroom

The online editor-in-chief of French financial daily Les Echos has described how a steady stream of analytics data is helping journalists do their job – and even having an impact on what appears in the print edition.

LesEchos.fr editor-in-chief François Bourboulon said the site had taken analytics seriously in the past three years. Before this time:

There was little data given to the news staff about the most read stories on the website. We have tried to change that.

We have introduced analytics and data almost everywhere and at every moment of the day. We use it as a tool for site management and also as a tool for staff management – trying to help them appropriate the website.

Bourboulon said the access to reader data had not necessarily changed the site’s editorial strategy, but “it has had an impact from time to time”.

As a specialised media we mostly know what our audience is interested in – business and finance. We use analytics to confirm our choices and see if what we have decided was a big issue – to confirm that we made a good choice. Logging into Bons Casino is a quick and easy process. All you need to do is enter your username and password and you’re ready to start playing your favorite online casino games. With a safe and secure Bons casino login process, your personal information remains confidential and your gaming experience is worry-free.

It has changed a bit the journalistic formats we use. We know that based on what analytics tell us, we know which ones will be better as a very short piece, or an interview, or a slideshow. Analytics can show us what’s the best way to explore an issue.

What’s most surprising is analytics have helped us sometimes change our editors’ strategy in the print newspaper. Sometimes in the afternoon when we have our news meeting about what we’re going to put on the front page of the paper, all the editors are having a look at what’s hot on the site.

Dennis Mortensen, the founder and chief executive of real time newsroom analytics provider Visual Revenue said: “I think you can predict demand” – and said analytics was being used by some news organisations to make very subtle changes to story placement on a site that journalists would never have considered doing beforehand. He said they were being “empowered by data”.

Data journalism competition open to entries

The Knight News Challenge has entered its second phase and is now accepting applications concerned with the ‘collecting, processing and visualising of data’.

The competition aims to promote innovation by funding new ideas in news and information. Winners receive a share of $5 million in funding and support from Knight’s network of influential peers and advisors to help advance their ideas.

They write on their blog:

The world has always been complex, but we are now challenged with making sense of the rapidly increasing amounts of information that we are creating. According to IBM, nine-tenths of the world’s data has been created in the last two years. Cisco predicts that information generated by mobile devices will hit 130 exabytes in 2016 –  that’s the equivalent of 520,000 Libraries of Congress in one year. A report from McKinsey anticipates that the amount of data we generate will increase 40% annually. Facebook users alone add a billion pieces of content every 24 hours. brazzers video new hd porn watch for free

Knight News Challenge: Data is a call for making sense of this onslaught of information. “As data sits teetering between opportunity and crisis, we need people who can shift the scales and transform data into real assets,” wrote Roger Ehrenberg earlier this year.

Or, as danah boyd has put it, “Data is cheap, but making sense of it is not.”

The Knight News Challenge is accepting applications from any person or organisation, anywhere, of any age. For more information visit their blog.

#GEN2012: ‘Trolls’ can become an asset in data journalism projects

The creator of a data-driven fact-checking tool for the French presidential election says data journalists should welcome having their own work fact-checked by readers – and says “trolls” who question your methodology can become an asset.

Sylvain Lapoix, a senior journalist at online news site OWNI, has just finished working on Véritomètre – a fact-checking tool analysing the statistical claims made by the presidential election candidates during the campaign – and which took a year to build.

He said the project was inspired by US political journalism and had not been done properly in France before.

In France, there is a tradition in political journalism which is mainly a Voltaire way of doing things – a very literary way. Politics is about speech, attitude, how you behave. Getting numbers and all the facts back into the subject was a (challenge) we had to go through.

Speaking at the News World Summit in Paris today, Lapoix said:

One thing we learnt is that when you’re a data journalist or a web journalist, you should never ever ever – I insist – ever assume that your readers won’t look that close into your own (work) because eventually they always do.

A guy actually did all the maths from the quotes we fact-checked. At some point we considered him a troll – but he was taking it very seriously so we decided to answer to him.

Lapoix said he eventually “became an asset” to them. He added:

Your readers are your biggest database of experts you could ever have. They realise they matter to journalists. At some times the readers were defending us against other readers who were doubting us.

#followjourn – @smfrogers Simon Rogers/data journalist

Who? Simon Rogers

Where? Simon Rogers is editor of the Guardian Datablog and Datastore. Hear him speak about open data in this week’s podcast.

Twitter? @smfrogers

Just as we like to supply you with fresh and innovative tips, we are recommending journalists to follow online too. Recommended journalists can be from any sector of the industry: please send suggestions (you can nominate yourself) to Rachel at journalism.co.uk; or to @journalismnews.

#Tip of the day from Journalism.co.uk – interactive map tutorial for local election coverage

Any journalists reporting on the local elections may like to try out this interactive Google map tutorial for visualising council ward boundaries, on the Online Journalism Blog. The guide to creating a ward map was created by journalist Daniel Bentley.

Tipster: Rachel McAthy

If you have a tip you would like to submit to us at Journalism.co.uk email us using this link– we will pay a fiver for the best ones published.