Category Archives: Online Journalism

Five tools to liven up local election reporting

If you are reporting on the referendum on the voting system, the Scottish, Welsh and Northern Irish assemblies or from one of the 305 town halls across England and Northern Ireland with local elections, how are you going to present the results?

As a text only story which reports how many seats have been lost or gained by each party? Or are you going to try visualising the results? Here are five free and easy to use tools to liven up the results.

1. Many Eyes

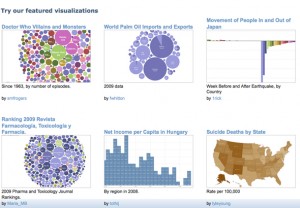
Many Eyes is a free data visualisation tool. If you have not tried your hand at any data journalism yet, today could be the day to start.

A. Create a Many Eyes account;

B. Create your spreadsheet using Excel, Open Office (free to download) or Google Docs (free and web based);

You could follow my example by putting ward names across the top, parties down the side and the number of each ward seats won by each party. You will need to include the total in the end column.

local elections example

C. Paste the data into Many Eyes, which will automatically read your pasted information;

D. Click ‘visualise’. In this example I selected the ‘bubble chart’ visualisation. Have a play with other visualisations too;

E. Copy the embed code and paste it into your story;

2. OpenHeatMap

OpenHeatMap is a way to visualise your results in a map. It is free and very easy to use. You start by creating a spreadsheet, uploading the data and you can then embed the map in your web page.

A. Go to OpenHeatMap (you don’t need a login);

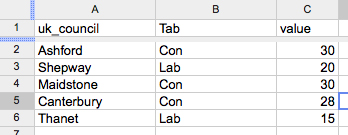
B. Create a spreadsheet. The easiest was to do this is in Google Docs. You must name your columns so OpenHeatMap can understand it. Use ‘UK_council’ for the local council, ‘tab’ for the party and ‘value’ for the number of seats. In this example, the tab column indicates the party with the most seats; the value is the number of seats;

C. Click ‘share’ (to the right hand side of your Google Doc), ‘publish as a web page’ and copy the code;

D. Paste the code into OpenHeatMap and click to view the map. In this example you will see the parties as tabs along the top which you can toggle between. You can change the colour, zoom in to your county or region and alter the transparency so you can see place names;

E. Click ‘share’ and you can copy the embed code into your story.

3. Storify

Anyone can now join Storify (it used to be by invitation only). It allows you to tell a story using a combination of text, pictures, tweets, audio and video.

A. Sign up to Storify;

B. Create a story and start adding content. If you click on the Twitter icon and search (say for ‘local election Kent’) you can select appropriate tweets; if you click on the Flickr icon you can find photos (you could ask a photographer to upload some); you can also add YouTube videos and content from Facebook. When you find an item you want to include, you simply drag and drop it into your story;

C. The art of a good Storify story is to use your skills as a storyteller. The tweets and photos need to be part of a narrative. There are some fantastic examples of story ideas on Storify;

D. Click to publish;

E. Copy and paste the embed code into the story on your site.

4. AudioBoo

You can record audio (perhaps the results as they are announced or reaction interviews with councillors) and include it in your story.

The easiest way is to download the free smartphone app or you can upload your own audio via the website.

A. Create an AudioBoo account;

B. Download the Android or iPhone app;

C. Record your short interview. You may decide to include a photo too;

D. Login to the audioboo website and click ’embed’;

E. Paste the embed code into your story.

Listen!

5. Qik

Qik is a free and allows you to live stream video. Why not broadcast the results as they happen?

A. Create a Qik account;

B. Download the app (iPhone, Android, Blackberry – a full list of supported phones is here);

C. The video will be automatically posted live to your Qik profile but you’ll need to add the code to your website before you record (you can also live stream to your Facebook page, Twitter account and YouTube channel).

D. To do this go to ‘My Live Channel’ (under your name). Click on it to get your embed code for your live channel.

E. Paste your embed code in your website or blog, where you want the live player to be.

How did you get on with the five tools? Let us know so that we can see your election stories.

War correspondents’ awards adds online journalism prize

The 18th Bayeux-Calvados Awards for War Correspondents are now open for entries, with the addition of a new category for online journalism.

A release from the award organisers said: “With the rise of digital technology, technological developments and changes in the way in which news is broadcast, new forms of narration have been created.

“There has been a vast increase in the number of multimedia projects in recent years, with the introduction of web documentaries, short multimedia works, video-graphics, etc. These new formats provide opportunities for finding out about international news in other ways (new information methods, new audiences).”

There are seven other prizes given out as part of the awards, for: written press; television; radio; photography; grand format television; and a young reporter prize.

Journalists have until 10 June to submit work photo, radio, television and written press reports on a conflict or news event relating to the fight for freedom and democracy. Submissions must have been made between the 1 June, 2010 and the 3 May, 2011.

There is a €7,000 (£6,300) grant to be won in each category, except for the Young Reporters category which offers €3,000 (£2,700).

The president of the jury for the prizes is Mort Rosenblum, a veteran US war correspondent and author of several books.

Who are the UK’s 100 most influential journalists online?

We have started to curate a list of the UK’s 100 most influential journalists online. We have come up with the first 50 names, we need you to help us come up with the other 50 (and knock anyone out who shouldn’t be in the list). Tweet @journalismnews and include the hashtag #J100.

We’re using PeerIndex, a tool that provides a relative measure of your social capital and ranks you between 1 and 100. PeerIndex measures your relative effectiveness and impact on Twitter and can score anyone with a Twitter account. By signing up to PeerIndex you can also associate your LinkedIn, Facebook, Quora and Tumblr accounts, helping PeerIndex to provide a more accurate ranking.

This score reflects the impact of your online activities, and the extent to which you have built up social and reputational capital on the web.

At its heart PeerIndex addresses the fact that merely being popular (or having gamed the system) doesn’t indicate authority. Instead we build up your authority finger print on a category-by-category level using eight benchmark topics.

Someone, however, cannot be authority without a receptive audience. We don’t simply mean a large audience but one that listens and is receptive. To capture this aspect PeerIndex Rank includes the audience score we calculate for each profile.

Finally, we include the activity score so account for someone who is active has a greater share of attention of people interested in the topics they are interested in.

Here is an example the scoring system.

If you are in the top 20 per cent by authority in a topic like climate change [or in this case, as a journalist], it means you have higher authority than 80 per cent of other people who we measure within this topic. Your normalized authority score for this topic (the one displayed on your page) will be in the range of 55 to 65 (that is, significantly lower than 80).

But remember, a score of 60 puts you higher that 80 per cent of people we track in that topic. A score of 65, means you rank higher than 95 per cent of the people we track. And we focus on tracking the top people on a specific topic, not just anyone.

There are more details about scores and rankings here and here.

If you’re interested in finding out your score, enter your Twitter login details on the PeerIndex website and you’ll get your own ‘vital statistics’. You’ll also be able to select topics of relevance and compare yourself to others. You do not have to be registered to be included in our list of top 100 UK journalists by online authority

PeerIndex statistics

‘Like Twitter on steroids’: New social network XYDO launches in beta

Digg gets drunk, has a threesome with Reddit and Newsboiler, which results in XYDO.

That’s how social news network XYDO, which launched in public beta yesterday, was described in one tweet.

XYDO on Twitter

Jeffrey Bates, co-founder of Slashdot.org, opted for:

If Reddit and Hacker News are social news 2.0, XYDO is clearly 3.0 and beyond.

And author Jesse Stay likened it to “Quora meets Digg” and “Twitter on steroids”, according to XYDO’s website.

If you’ve used Digg, Reddit, Newsboiler and Quora, that’s all you need to know. If not, read on.

XYDO takes a bit of getting used to and I’ve not come across any handy video guides, but the following should help you find your way around.

What is XYDO?

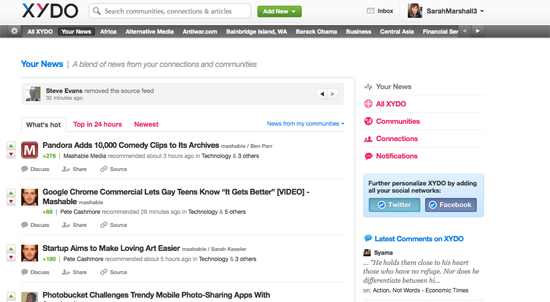
XYDO is a social news network that takes stories from your Twitter and Facebook feeds. Users then collectively prioritise and organise stories by pushing them up or down the list. The ranking is influenced by clicking the green arrow up, the red arrow down and by sharing on Twitter and Facebook.

XYDO ranking

You will automatically be following the people you follow on Twitter and you will be assigned to various communities based on your Twitter connections.

You can view either news from your ‘connections’ or from your ‘communities’ and get a story list in a form which suits you: by custom RSS, email, tweeted links or Facebook.

So what does XYDO mean for journalists and newsrooms?

It is a source of stories. It is a way of networking, discussing stories and tailor-making your own news story feed.

You can also join communities (like ‘media and journalism’, which is already set up) and even create your own community.

It is also a way of increasing site traffic. You can submit stories, which will then be ranked by others on XYDO.

XYDO screengrab

You can follow @xydoapp on Twitter. “Media experts” from XYDO also curate various communities on Twitter channels. You can follow @x_mediajourn for “the best news and blog posts on the topic of media and journalism”, for example.

Read more about XYDO on MashableReadWriteWeb and Musings from Sussex.

Journalisted Weekly: Royal Wedding fever, AV, and Syria crackdown

Journalisted is an independent, not-for-profit website built to make it easier for you, the public, to find out more about journalists and what they write about.

It is run by the Media Standards Trust, a registered charity set up to foster high standards in news on behalf of the public, and funded by donations from charitable foundations.

Each week Journalisted produces a summary of the most covered news stories, most active journalists and those topics falling off the news agenda, using its database of UK journalists and news sources.

For the week ending Sunday 1 May

  • Royal Wedding outshines AV throughout the news
  • Syria’s crackdown on protesters dominates international news
  • Syrian funding to St Andrews University and Belgium’s burqa ban hardly covered

Covered lots

  • The Royal Wedding, with Will and Kate tying the knot on Friday and the nation getting a holiday, 867 articles
  • AV referendum, with nationwide voting on 5th May, 144 articles
  • Anti-government protests in Syria, with 42 alleged deaths in Dera’a on Friday, 200 ruling Ba’ath members resigning, and foreign journalists banned from the country, 91 articles

Covered little

Political ups and downs (top ten by number of articles)

Celebrity vs serious

Arab spring

Who wrote a lot about…’Royal Wedding’

Gordon Rayner – 10 articles (Telegraph), Duncan Larcombe – 7 articles (The Sun), Martin Beckford – 7 articles (Telegraph), Richard Kay – 6 articles (MailOnline), Ann Gripper – 5 articles (The Mirror)

Long form journalism

More from the Media Standards Trust

Visit the Media Standards Trust’s new site Churnalism.com – a public service for distinguishing journalism from churnalism

Churnalism.com ‘explore’ page is available for browsing press release sources alongside news outlets

The Media Standards Trust’s unofficial database of PCC complaints is available for browsing at www.complaints.pccwatch.co.uk

For the latest instalment of Tobias Grubbe, journalisted’s 18th century jobbing journalist, go to journalisted.com/tobias-grubbe

The death of Osama bin Laden: New York Times interactive gauges public opinion

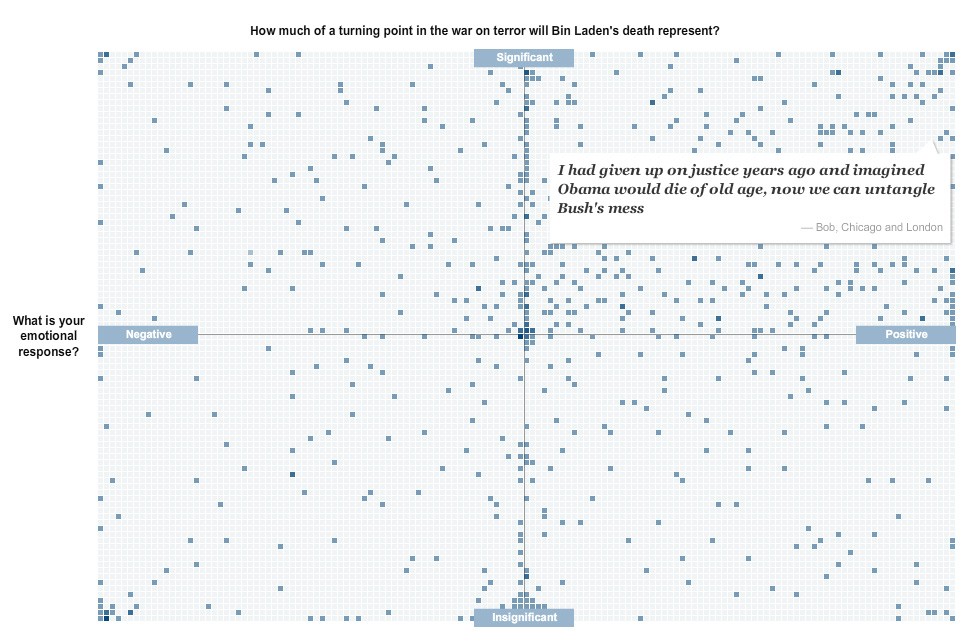
I really like this interactive feature from the excellent New York Times graphics team on readers’ reactions to the death of Osama bin Laden.

As a way of organising responses to a crowdsourcing exercise it isn’t anything new, it takes off from mapping responses geographically. But it is simple and effective, mixing text responses with a broad visual understanding of where the readership’s sentiments fall.

Interesting to see how many people sit right on the fence in the significance stakes.

The image below is a completely non-interactive screengrab of the feature, but follow this link for the full experience.

The NYT team has also put together some impressive graphics showing the layout of the compound, geography of the area and timeline of events.

paidContent: Managing editor of Huffington Post Media Group leaving for Yahoo

Managing editor of the Huffington Post Media Group Jai Singh, is leaving for a role as Yahoo Media Network editor in chief, paidContent reports.

At Yahoo, he will be responsible for increasing original content and performance across all platforms—and for all of YMN’s leading brands, not only Yahoo News.

Read more from paidContent on this here. Yahoo also reported the move itself.

Ten things every journalist should know about data

Data visuals

Every journalist needs to know about data. It is not just the preserve of the investigative journalist but can – and should – be used by reporters writing for local papers, magazines, the consumer and trade press and for online publications.

Think about crime statistics, government spending, bin collections, hospital infections and missing kittens and tell me data journalism is not relevant to your title.

If you think you need to be a hacker as well as a hack then you are wrong. Although data journalism combines journalism, research, statistics and programming, you may dabble but you do not need to know much maths or code to get started. It can be as simple as copying and pasting data from an Excel spreadsheet.

You can find out more about getting started and trying your hand at complex data journalism at news:rewired – noise to signal, on 27 May. More details about the event are here and you can order tickets, which cost £156 including VAT, by clicking here.

Here are 10 reasons to give data a go.

1. Everybody loves a list. Did you click on this post as you wanted an easy-to-read list rather than an involved article?

2. Everybody loves a map. Try Quantum GIS (QGIS), a free, open source tool, or OpenHeatMap, a fantastic, east-to-use tool as long as your data is categorised by country, local authority, constituency, region or county.

3. Tools bring data to life. Applications such as ManyEyes and Yahoo Pipes mash data and turn complex numbers and datasets into easy to read visualisations that work well both online and in print. Try this how to guide to Yahoo Pipes to get you started. Here are 22 data visualisation tools from Computer World.

4. Data may need cleaning up. Try using clean up tools like Scraperwiki, which helps non-technical journalists copy a few lines of code to turn a document such as pdf into a number-friendly file like a csv, and Google Refine, which Paul Bradshaw has written some useful posts on over on the Online Journalism Blog.

5. Data of all sorts is increasingly available. The open data movement across the UK is resulting in an increase in the release of data. The possibilities are huge, says Paul Bradshaw on the Guardian’s Datablog. January 2010, saw the launch of data.gov.uk, a fantastic resource for searching for datasets.

6. Data journalism can answer questions. A good place to start in data journalism is to ask a question and answer it by gathering data. Numbers work well. One option is to submit a Freedom of Information request to ask for the numbers. It helps if you ask for a csv file.

7. You can use the crowd. Crowdsourcing by asking a question on Twitter or using a site like Help Me Investigate, an open source tool for people can use to collaborate to investigate questions in the public interest.

8. Data can be personal to every reader. DocumentCloud can highlight and annotate documents to help readers see what is important and learn a document’s back story.

9. “Data journalism is not always presenting the data as journalism. It’s also finding the journalism within the data,” Jay Rosen said in relation to this article on Poynter on how two journalists from the Las Vegas Sun spent two years looking at 2.9 million documents to find out what “what’s right, and wrong, about our local health care delivery system”. The result was that the journalists exposed thousands of preventable medical mistakes in Las Vegas hospitals. The Nevada legislature responded with six pieces of legislation.

10. “Data ethics is just as important as ethics in journalism, in fact they are one in the same,” according to this post on Open Data Wire. Consider the BBC’s FoI request which showed a 43 per cent rise in GPs signing prescriptions for antidepressants and the ethics of unquestioningly relating this to the recession. Ben Goldacre has highlighted the problems with seeing patterns in data.

This is a cross post originally published on the news:rewired website. You can get your tickets here.

A full agenda for news:rewired – noise to signal, is here. A list of more than 20 speakers is here.

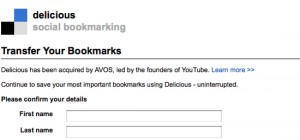
Delicious users have until July to transfer to new owners

Users of the web-based social bookmarking site Delicious are being asked to transfer their accounts to AVOS, the social bookmarking and sharing platform’s new owners – the founders of YouTube.

Delicious transfer message

Users who do not to transfer to the new service will be able to access their accounts for approximately two months, after which time they will be closed.

Chad Hurley and Steve Chen, who set up YouTube and sold it to Google in 2006 for $1.65 billion, said their “first hand expertise enabling millions of consumers to share their experiences with the world” will be used in developing Delicious.

“We’re excited to work with this fantastic community and take Delicious to the next level,” Hurley said in a press release. “We see a tremendous opportunity to simplify the way users save and share content they discover anywhere on the web.”

In December, Yahoo stated Delicious “was not a strategic fit” within the company and then announced it was seeking a buyer.

The sale to AVOS was announced yesterday for an undisclosed sum.

What is Delicious and why is it useful to journalists?

When it appeared that Delicious was to be shut down, Paul Bradshaw wrote an article on his Online Journalism Blog of its importance to journalists.

I am hugely sad about [the closure] – Delicious is possibly the most useful tool I use as a journalist, academic and writer.

Not just because of the way it makes it possible for me to share, store and retrieve information very easily – but because of the network of other users doing just the same whose overlapping fields of information I can share.

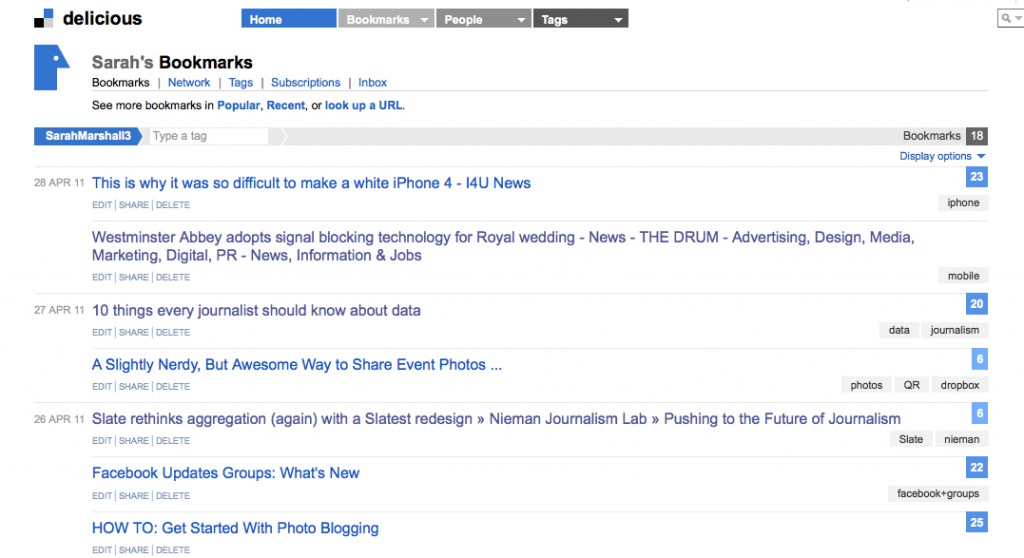
Delicious is a social bookmarking service for saving, sharing, and discovering web bookmarks.

It was started in 2003 and acquired by Yahoo in 2005.

Instead of having different bookmarks saved on every computer, Delicious allows you to save and tag news articles or interesting sites and share with others.

The Delicious logo is often displayed on the share option of a news story.

Users build their own network to follow or have their bookmarks followed by other users.

By tagging saved bookmarks Delicious users can keep track of areas of interest.

delicious screenshot

Five of the best Tumblr news blogs

Blogging site Tumblr is growing at an incredible speed. There are now 32 million people in the US 4.5 million people in the UK visiting the site.

News organisations are engaging with the community by setting up their own Tumblr blogs. The Guardian set up a Tumblr account in January and started posting stories in February.

We have been taking a look at the Tumblr blogs of news organisations from around the world and have compiled a list of our favourite five.

1. Canada’s National Post

Why? For its use of photographs, front pages and graphics.


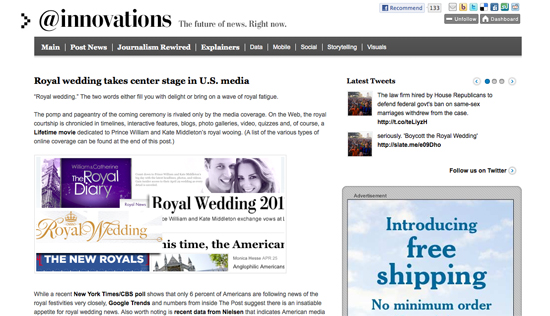
2. Washington Post’s Innovations

Why? For its linking of third party content, integration into its main site and the superb technology content (minus the deluge of royal wedding posts)

Washington Post Innovations

3. The Guardian

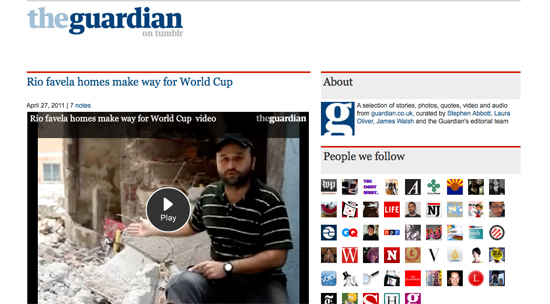
Why? For its design. It looks just like the Guardian. It includes a well-thought out layout, quantity and type of stories.

Guardian on Tumblr

3. LA Times

Why? For it tone and fabulous collection of photos.

LA Times on Tumblr

5. Newsweek

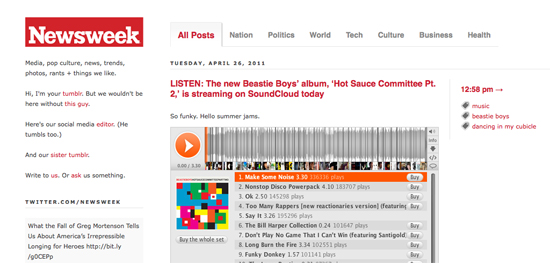
Why? For being very social and introducing us to their Tumblr person, linking multimedia content such as SoundCloud and for handy tabs within their layout theme

Newsweek Tumblr

Follow our how to guide to creating a Tumblr blog for a news organisation.