Category Archives: Data

David Higgerson: ‘Actionable’ news and what it means for data journalism

David Higgerson blogs about the idea of ‘actionable’ news – a phrase that he first heard at last week’s Society of Editors conference from Reuters’ Jodie Ginsberg:

I see actionable news being right at the heart of the idea of data journalism. Information may well be freely available in a way we’ve never seen before, but that doesn’t mean the role of the storyteller has fallen by the wayside. As long as the writer who gets to grips with a spreadsheet of data is also plugged into the community they serve, and knows what they are interested in, then we’ve got actionable news (…) It shouldn’t be a revelation to journalists – after all, newsroom planners have certain data-rich days marked in every year, such as GCSE league tables day. But rather than be dictated to by a government planning calendar, journalists who can marry data access to issues which impact on people’s lives can provide make their work, and the titles they work for, more relevant to an audience than ever before.

Full post on David Higgerson’s blog at this link…

Guardian: Analysing data is the future for journalists, says Tim Berners-Lee

Speaking in response to recent releases of data by the UK government, Tim Berners-Lee, father of the world wide web, says:

The responsibility needs to be with the press. Journalists need to be data-savvy. It used to be that you would get stories by chatting to people in bars, and it still might be that you’ll do it that way some times.

But now it’s also going to be about poring over data and equipping yourself with the tools to analyse it and picking out what’s interesting. And keeping it in perspective, helping people out by really seeing where it all fits together, and what’s going on in the country.

Agree or disagree?

Full story at this link on Guardian.co.uk…

Government spending: Who’s doing what with the new data?

Today sees the biggest release of government spending data in history. Government departments have published details of all spending over £25,000 for the past six months and, according to this morning’s announcement, will continue to publish this expenditure data on a monthly basis.

According to minister for the Cabinet Office and paymaster general Francis Maude, it is part of a drive “to make the UK the most transparent and accountable government in the world”.

We’ve already released a revolutionary amount of data over the last six months, from the salaries of the highest earning civil servants to organisation structure charts which give people a real insight into the workings of government and is already being used in new and innovative ways.

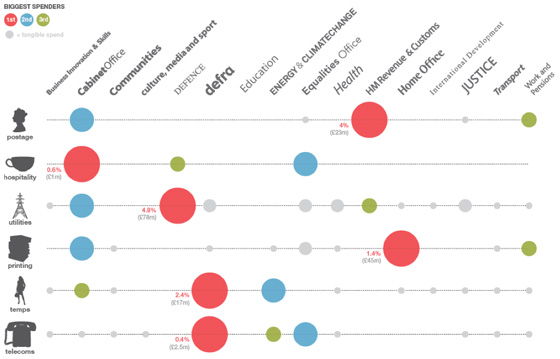
A huge amount of public spending data has indeed been published under the current government, and today’s release is a significant addition to that. So who is doing what with the vast amount of new data? And who is making it easier for others to crunch the numbers?

The Guardian is usually streets ahead of other newspapers in processing large datasets and today’s coverage is no exception:

Who else?

There are, of course, different ways of looking at the numbers, as one Guardian commenter, LudwigsLughole, highlights:

There are 90,000 HMRC staff. They spent £164,000 in six months on bottled spring water. That equates to an annual spend per head of only £3.64. So the FT are seriously suggesting that £3.64 per head to give staff fresh bottled water is excessive? Pathetic journalism.

Exploring the data yourself

“The biggest issue with all these numbers is, how do you use them? If people don’t have the tools to interrogate the spreadsheets, they may as well be written in Latin.” – Simon Rogers, Guardian Data Blog editor.

“Releasing data is all well and good, but to encourage the nation’s ‘armchair auditors’, it must be readily usable.” – Martin Stabe, FT.

Here are some of the places you can go, along with the Guardian, to have a crack at the numbers yourself. Please add your own suggestions in the comments below.

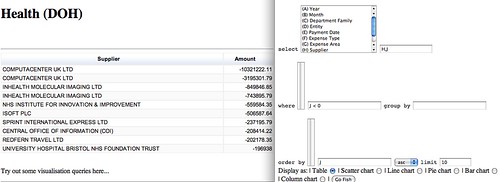
Lots and lots of data. So what? My take on it was to find a quick and dirty way to cobble a query interface around the data, so here’s what I spent an hour or so doing in the early hours of last night, and a couple of hours this morning… tinkering with a Gov spending data spreadsheet explorer:

Guardian/gov datastore explorer

[T]he real power of this data will become clear in the months to come, as developers and researchers – you? – start to link it to other information, like the magisterial OpenlyLocal and the exciting WhosLobbying. Please make use of our API and loading scripts to do so.

Also see the good suggestions on Where Does My Money Go? for how government data publishing might be improved in the future.

So, coming full circle I return to the Guardian, and to the data-minded Simon Rogers, who asks: Will the government spending data really change the world?

A big question. Feel free to add your opinion below and any other data projects you have seen today or that pop up in the future.

Google News experiments with new metatags in drive to give credit where it’s due

Google News has outlined two new metatags it is experimenting with as part of efforts to ensure journalists are correctly credited for their work, by identifying the URLs of syndicated and original copy. In an announcement on its blog yesterday, Google News said:

News publishers and readers both benefit when journalists get proper credit for their work. That can be difficult, with news spreading so quickly and many websites syndicating articles to others. That’s why we’re experimenting with two new metatags for Google News: syndication-source and original-source. Each of these metatags addresses a different scenario, but for both the aim is to allow publishers to take credit for their work and give credit to other journalists.

The first metatag, syndication-source, indicates the preferred URL for a syndicated article:

…if Publisher X syndicates stories to Publisher Y, both should put the following metatag on those articles: <meta name=”syndication-source” content=”http://www.publisherX.com/wire_story_1.html”>

Then for the original-source metatag, the code would indicate the URL of the first article to report on a story with the following: <meta name=”original-source” content=”http://www.example.com/burglary_at_watergate.html”>

In both cases the tags can be used by either the syndicator or journalist responsible for the original copy to identify their work, and then also those who use it in the production of their own reports to offer credit back to those parties.

Google News says that at the moment it will not make any changes to article ranking based on the original-source tag.

We think it is a promising method for detecting originality among a diverse set of news articles, but we won’t know for sure until we’ve seen a lot of data. By releasing this tag, we’re asking publishers to participate in an experiment that we hope will improve Google News and, ultimately, online journalism.

Read more on this here…

#iweu: The web data revolution – a new future for journalism?

David McCandless, excited about data

Rounding off Internet Week Europe on Friday afternoon, the Guardian put on a panel discussion in its Scott Room on journalism and data: ‘The web data revolution – a new future for journalism’.

Taking part were Simon Rogers, David McCandless, Heather Brooke, Simon Jeffery and Richard Pope, with Dr Aleks Krotoski moderating.

McCandless, a leading designer and author of data visuals book Information is Beautiful, made three concise, important points about data visualisations:

  • They are relatively easy to process;
  • They can have a high and fast cognitive impact;
  • They often circulate widely online.

Large, unwieldy datasets share none of those traits, they are extremely difficult and slow to process and pretty unlikely to go viral. So, as McCandless’ various graphics showed – from a light-hearted graph charting when couples are most likely to break up to a powerful demonstration of the extent to which the US military budget dwarfs health and aid spending – visualisations are an excellent way to make information accessible and understandable. Not a new way, as the Guardian’s data blog editor Simon Rogers demonstrated with a graphically-assisted report by Florence Nightingale, but one that is proving more and more popular as a means to tell a story.

David McCandless: Peak break-up times, according to Facebook status updates
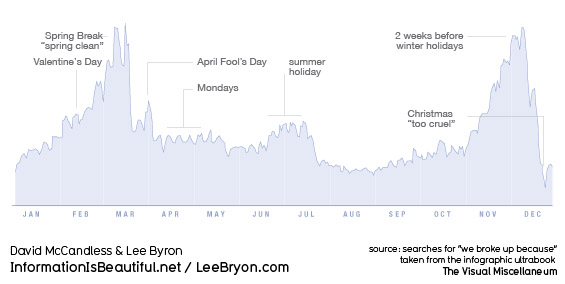
But, as one audience member pointed out, large datasets are vulnerable to very selective interpretation. As McCandless’ own analysis showed, there are several different ways to measure and compare the world’s armies, with dramatically different results. So, Aleks Krotoski asked the panel, how can we guard against confusion, or our own prejudices interfering, or, worse, wilful misrepresentation of the facts?

McCandless’ solution is three-pronged: firstly, he publishes drafts and works-in-progress; secondly, he keeps himself accountable by test-driving his latest visualisations on a 25-strong group he created from his strongest online critics; third, and most important, he publishes all the raw data behind his work using Google docs.

Access to raw data was the driving force behind Heather Brooke’s first foray into FOI requests and data, she told the Scott Room audience. Distressed at the time it took her local police force to respond to 999 calls, she began examining the stats in order to build up a better picture of response times. She said the discrepancy between the facts and the police claims emphasised the importance of access to government data.

Prior to the Afghanistan and Iraq war logs release that catapulted WikiLeaks into the headlines – and undoubtedly saw the Guardian data team come on in leaps and bounds – founder Julian Assange called for the publishing of all raw data alongside stories to be standard journalistic practice.

You can’t publish a paper on physics without the full experimental data and results, that should be the standard in journalism. You can’t do it in newspapers because there isn’t enough space, but now with the internet there is.

As Simon Rogers pointed out, the journalistic process can no longer afford to be about simply “chucking it out there” to “a grateful public”. There will inevitably be people out there able to bring greater expertise to bear on a particular dataset than you.

But, opening up access to vast swathes of data is one thing, and knowing how to interpret that data is another. In all likelihood, simple, accessible interfaces for organising and analysing data will become more and more commonplace. For the release of the 400,000-document Iraq war logs, OWNI.fr worked with the Bureau of Investigative Journalism to create a program to help people analyse the extraordinary amount of data available.

Simply knowing where to look and what to trust is perhaps the first problem for amateurs. Looking forward, Brooke suggested aggregating some data about data. For example, a resource that could tell people where to look for certain information, what data is relevant and up to date, how to interpret the numbers properly.

So does data – ‘the new oil’ – signal a “revolution” or a “new future” for journalism? I am inclined to agree with Brooke’s remark that data will become simply another tool in the journalists armoury, rather than reshape things entirely. As she said, nobody is talking about ‘telephone-assisted reporting’, completely new once upon a time, it’s just called reporting. Soon enough, the ‘computer-assisted reporting’ course she teaches now at City University will just be ‘reporting’ too.

See also:

Guardian information architect Martin Belam has a post up about the event on his blog, currybetdotnet

Digital journalist Sarah Booker liveblogged presentations by Heather Brooke, David McCandless and Simon Rogers.
Heatmap measures significance of Europe’s newspapers

Professor of cross media content at the School of Journalism and Communication at Hogeschool Utrecht, Dr Piet Bakker, has produced an interesting heatmap to illustrate the ‘significance’ of European newspapers.

Following the predictions of futurist Ross Dawson last week that newspapers in the UK will be “extinct” in their current form by 2019, Bakker writes on his Newspaper Innovation blog that rather than measuring the insignificance of newspapers over time he wanted to do the opposite, using circulation and population data.

His results, based on the number of newspapers per 100 inhabitants, places Luxembourg at the top overall, while Norway leads when it comes to paid newspapers only.

The only consistent data we have for almost every country in the world are total circulation and population. If we define newspaper significance as the number of copies per 100 (15+) inhabitants, we can compare countries, see how this changes over years and predict how it will develop.

The graph below (made with Google Docs and the heat-map gadget) show this “significance”, the darker the color, the more significant newspaper are.

Hatip: paidContent

ProPublica: How we got the government’s secret dialysis data

Today, US non-profit ProPublica begins publishing the findings of a long-term investigation into the provision of dialysis in the US, which will also be published by the Atlantic magazine. In an editors note on the site, Paul Steiger and Stephen Engelberg explain how reporter Robin Fields spent two years pressing officials from the Centers for Medicare and Medicaid Services (CMS) to release a huge dataset detailing the performance of various dialysis facilities.

Initially, she was told by the agency that the data was not in its “possession, custody and control.” After state officials denied similar requests for the data, saying it belonged to CMS, the agency agreed to reconsider. For more than a year after that, officials neither provided the data nor indicated whether they would.

ProPublica finally got its hands on the data, after the Atlantic story had gone to print, but plans “to make it available on our website as soon as possible in a form that will allow patients to compare local dialysis centers.”

Full story at this link.

Social media and citizen journalism help chart China’s violent land grabs

In the absence of an independent media, citizen journalism and social media have thrived in China and Chinese people have used the internet to report on civil and human rights abuses ignored by mainstream media.

Now an anonymous Chinese blogger called Bloody Map has collated incidents of illegal land grabs and property demolitions and plotted them on Google Maps.


The project, called 血房地图 (xuefang ditu or “Bloody Map”), charts often-violent evictions and demolitions throughout China. According to the project’s Sina account (now invite-only), its aim is to:

… collect and list cases of violent eviction which have, or will, already faded from public view; some cases going back 2-3 years I had to dig up myself, but with your support, it’ll be much easier. When I say that new housing is being built right now on land covered in blood, people know what I mean.

There are forceful evictions taking place now which need more media attention, Bloody Map on its own isn’t an appropriate platform to that end. People can’t expect that an effort like this will create enough attention to put an end to current forced evictions. The goal of this site is to present evidence allowing consumers to make decisions. If a day comes when this tiny map is able to make people within the interest chain of a particular eviction reconsider their actions, then it will have achieved its goal.

There are actually two Bloody Maps: a “revised” version edited by the founder that shows only cases reported by media, and an “open” version that anyone can add to or edit. Contributors use symbols to specify the nature of the property-related violence: video cameras for media coverage; volcanoes for violence during protests; beds for when property owners were killed; and flames for when those resisting eviction set themselves on fire.

Since launching a month ago on October 8, the maps have recorded 130 incidents and attracted more than 476,000 views. The founder says incidents will be removed when the media reports the resolution of conflicts. The project itself has attracted some media attention, with both the Shanghai Daily newspaper (subscription required) and Xinhua news agency reporting on the maps.

Colin Shek is an NCTJ print postgraduate from the University of Sheffield, currently based in Shanghai. This post was originally published on his website: www.colinshek.com. He can be found on Twitter at: www.twitter.com/colinshek

CJR: The US newsrooms doing interactivity on a budget

The Columbia Journalism Review (CJR) takes a look at some US news organisations who are producing data visualisations and interactives for their websites with limited budgets and staff resources.

I believe the Times’ [New York Times] newsroom has at least two dozen people working full time on interactive projects; many smaller papers might be lucky to have a handful of people who know Flash. Even if newsrooms have graphic artists working on election-result maps for the papers’ print versions, many do not necessarily allocate the same level of staff time to online displays.

Full article on the CJR’s website at this link…

Making data work for you: one week till media140’s dataconomy event

There’s just one week to go before media140’s event on data and how journalists and media can make better use of it. Featuring the Guardian’s news editor for data Simon Rogers and Information is Beautiful author David McCandless, the event will discuss the commercial, ethical and technological issues of making data work for you.

Rufus Pollock, director of the Open Knowledge Foundation, and Andrew Lyons, commercial director of UltraKnowledge will also be speaking. Full details are available at this link.

Journalism.co.uk is proud to be a media partner for media140 dataconomy. Readers of Journalism.co.uk can sign-up for tickets to the event at this link using the promotional code “journalist”. Tickets are currently available for £25, which includes drinks.

The event on Thursday 21 October will be held at the HUB, King’s Cross, from 6:30-9:30pm.