Category Archives: Traffic

Google’s +1 button now acts like Facebook share

Google+ users can now use the +1 button to share content with their circles of contacts within the new social network.

Following the development this week the button will act like Facebook’s share button in that anyone with a Google+ profile can directly share a link to their wall (or stream in Google+ terminology).

Google made the announcement on its blog yesterday and said it would be rolled out over the next few days.

The +1 button was launched at the beginning of June, allowing anyone logged in to a Gmail account to recommend web content to their contacts, who would then see a personally ranked suggestion when using Google Search. At the end of June Google+ was launched by the search engine giant which appeared to be taking on Facebook by creating its own social network.

The fact the button now acts like a Facebook share widget may persuade a few more news sites to adopt it. Take up early on appeared to have been slow based on often lower traffic referrals when compared to other share buttons.

In yesterday’s blog post, Google also announced another development of interest to publishers: the creation of “snippets”.

When you share content from the +1 button, you’ll notice that we automatically include a link, an image and a description in the sharebox. We call these snippets, and they’re a great way to jumpstart conversations with the people you care about.

Of course: publishers can benefit from snippets as well. With just a few changes to their webpages, publishers can actually customise their snippets and encourage more sharing of their content on Google+. More details are available on the Google Webmaster blog.

The video below takes you directly to an explanation of snippits.


Poynter: How to set up Newsbeat, real-time analytics tool for news sites

Poynter has a handy eight-step guide for anyone wanting to test out Newsbeat, a recently launched real-time analytics tool specifically for news sites.

It comes with a hefty monthly price tag but there is a free trial on offer.

One of the advantages of Newsbeat, over free tools such as Google Analytics, is the ability to customise it for various members of the team, as Poynter’s post explains:

For example, managing editors can use it to see analytics for an entire site, section editors can personalise it to see analytics for the sections they edit, and reporters can use it to see analytics for their own stories. You can navigate through the tool to see smaller or bigger pictures of what’s going on within the site.

It also sends alerts when something unusual happens.

Newsbeat by default will send email alerts when traffic spikes above average, a page goes down or something else out of the ordinary happens.

But you can also set-up customized email or SMS (i.e. text) alerts that let you know whether people are reading or commenting on an article more than usual, or if a page is having problems loading.

The full Poynter ‘how to’ guide is at this link.

The top 10 most-read stories on Journalism.co.uk, 13-19 August

1.  Ten things every journalism student should know

2. How to: know when to use photos from social media

3. Editorial in Newsquest papers calling for capital punishment ‘was just a bit of fun’

4. PCC rejects Wayne Rooney’s complaint over tax story

5. Tool of the week for journalists – WhoReTweetedMe

6. Facebook study finds Independent’s content was shared and likes 136,000 times in one month

7. Hundreds complain to BBC over Starkey’s Newsnight remarks

8. Israel: Al Jazeera bureau chief ‘held without charge’

9. Second country expected to adopt group paywall later this year

10. FBI finds ‘no hard evidence’ of 9/11 phone hacking


Facebook study finds Independent’s content was shared and liked 136,000 times in one month

Facebook has published a report on the way the Independent uses the social network to share content. The study has found people liked or shared content from the Independent 136,000 during a “recent” month.

These actions were then seen 68,845,050 times on Facebook, with a click-through rate of 0.53 per cent.

The study also found “each action through a social plugin”, such as the recommend button, has driven an average of 2.67 referrals back to the Independent. It also found Facebook referrals result in readers spending an average of seven seconds longer on a destination page.

The Independent’s success in engaging with readers using Facebook and traffic referrals form the social media site increasing by 430 per cent last year has been well documented by Journalism.co.uk. Jack Riley, the Independent’s head of digital audience and content development explained in this post and this podcast, how the Independent has created specific Facebook pages for football teams and columnists such as Robert Fisk, whose page has accumulated more than 24,000 fans.

The first stage of the implementation of the Independent’s Facebook strategy involved adding the recommend plugin at the top and bottom of the article; the second involved the creation of open graph pages for columnists and sports teams.

Nieman: Blogs, SEO chief and Facebook comments result in traffic increase for LA Times

The Los Angeles Times is experiencing an increasing amount of traffic, which Nieman Journalism Lab is attributing to engaging with its audience using its blogs.

In March the site had more than 160 million pageviews; in May it was 189 million, bucking the downward trend of many other major US sites. The Nieman report states:

That doesn’t mean the LA Times is going to lap the New York Times or the Huffington Post when it comes to reader counts. But the numbers are still impressive, and more so when you consider the secret sauce at the heart of it all: a full embrace of blogging that adds voice in some corners, emphasises timeliness in others, and has opened new doors for reader engagement. On latimes.com, news is getting the blog treatment and blogs are getting the news treatment. “Most of our blogs are reported stories,” said Jimmy Orr, managing editor/online for the Times. “What we’re seeing is big increases in our blogs, and that’s where a lot of the breaking news is.

The post goes on to explain some other changes at the LA Times, too. The site has recently added an SEO chief, “who works on the copy desk to optimise headlines” resulting in a “65 per cent rise in traffic from search and a 41 per cent jump in traffic from Google as compared to this time last year”.

Another move by the LA Times is to make the site more social by adding Facebook comments to around 50 per cent of articles, a move that has resulted in a 450 per cent increase in referrals from Facebook, according to Nieman’s post.

It also plans to expand its use of Facebook as a commenting system because of encouraging results it’s seen so far. The goal is a virtuous circle: A bigger community leads to more traffic leads to more impact for the Times’ journalism.

It is worth reading the full post on the LA Times’ traffic report which lists examples of the LA Times blogs, including LA Now, “which looks like a blog, but is actually a driver for breaking news”.


Second country expected to adopt group paywall later this year

Three months on from Slovakia’s group paywall going up around nine news outlets, with “promising results”, means a second small country is expected to adopt the model before the end of the year, according to Piano Media, the company which signed up the publishers and put up the paywall.

Tomas Bella, chief executive of Piano Media told Journalism.co.uk that the paywall generated €40,000 in the first month. The company aimed to sign up around 1 per cent of Slovakia’s 2.5 million internet uses in the first 12 months. He said that after three months the company has achieved two thirds of the target for the first year.

Bella said:

Piano expects to launch one more country this winter and it is likely that a few more countries will follow next year.

Bella did not reveal which countries are expected to follow Slovakia’s model explained that serious discussions are talking place.

We are now thinking about some of the smaller to medium-sized European countries which maybe some of the Scandanavian countries.

We’ve also had interest from France and from Australia.

Bella explained that Piano’s first foray into the bigger markets, such as France and Australia, is likely to trial group paywalls for regional news sites or parts of sites, such as sport.

Slovak paywall model

Nine major publishers with more than 40 websites entered a joint paywall deal in Slovakia which went up in April.

Users are charged €2.90 a month to access content – a bit like paying a satellite or cable TV subscription to view channels owned by different broadcasters.

Piano developed an algorithm that times how long a reader spends on a site, with content weighted accordingly. So the longer a reader spends on a publisher’s site, the more revenue that publisher generates. Video therefore pays more than editorial and the model does not encourage crafty headline writing to generate clicks.

Different sites in Slovakia have opted for varying restrictions with some being extremely porous paywalls with just one article behind the wall, some charge people to access comments or to participate in forums, other sites have much stricter Times-style pay-to-view.

Some Slovak sites opted not to sign up to the paywall deal, Bella explained, but said the “the number of readers for the sites that went behind paywalls is basically very comparable to the sites that remained outside of the paywall”.

It didn’t cause any big drop in the number of readers, it caused only some drops in traffic to specific areas of the sites that went behind the paywall.

Bella also said visitors are moving between paywalled sites, a benefit of the joint model.

Funnily enough in June and July the news sites that are inside the Piano paywall were even doing a little bit better in traffic than the ones that are outside the paywall.

Bella has talked to 10 publishers in the UK and explained from next month the company will be negotiating a deal for a UK publisher with websites abroad.

He told Journalism.co.uk, he thinks adoption in Britain requires wider use elsewhere, with English language sites being far more difficult to sign up to a group paywall deal due to competition from abroad.

I’m not saying it won’t work in Britain but we have to prove it in two or three more countries first.

In Slovakia companies that opted out of the paywall initially will be joining next month.

Publishers that are already part of the group are now “fine tuning” what they put behind the wall. Additional content will go behind the wall and a small amount will be brought in front of the wall.

Changes will be made both ways but much more content is going behind the wall.

The funny thing is some of [the companies that did sign up] said we didn’t want to tell you before but we never thought it would work.

Bella said Piano Media had not heard of any publishers losing advertising revenue due to the wall.

Advertisers and media agencies might be a little worried as publishers are getting a little bit independent and less dependent on their revenue.

The top 10 most-read stories on Journalism.co.uk, 6-12 August

1. London riots: Five ways journalists used online tools

2. London riots: journalists attacked across city

3. Student’s riot blog brings in a million views in one day

4. ‘It’s gone viral’: How a student’s riot liveblog brought a million views in a day

5. How to: shoot and edit video on an iPhone

6. BBC reporters flee on foot as radio car torched in Salford

7. Journalism school to appeal loss of NCTJ accreditation

8. ‘They were planning to kill me, it was really bad’

9. IPCC ‘may have misled’ media over Duggan shooting

10. New York Times launches collaborative testing website

Newspaper Society: Round-up of record web traffic for local media titles covering riots

The Newspaper Society today (11 August) published a series of figures for local media titles covering the recent riots across England. According to the NS, many news sites saw record traffic levels as the public swarmed to their local paper’s for the latest updates on the violence.

Some of the highest online statistics from the NS report are below:

  • The Liverpool Echo: Initial story on the riots recorded 850,000 page views. Said to be most-read story on the Trinity Mirror Regionals network. Live blog on Tuesday and Wednesday viewed by more than 85,000 people. Overall website recorded around 3 million page views and 400,000 unique users over the two days.
  • Express and Star: On Tuesday its website recorded 853,000 homepage views.
  • The Enfield Independent: Recorded 203,000 page views on site in 24 hours on Sunday.
  • The Nottingham Post: 120,000 unique users (also on Tuesday), said to be three times the normal level of traffic. Monday night’s lead report attracted 64,000 page views while picture gallery of aftermath received 120,000 page views.
  • This is Gloucestershire: Two picture galleries containing reader-submitted photos received more than 473,000 page views, as of 2pm Wednesday.
  • The Birmingham Mail: More than 100,000 unique users on Tuesday, with page views up more than 300 per cent on average levels.

Read the full statistics here…

‘It’s gone viral’: How a student’s riot liveblog brought a million views in a day

When the riots broke out in London and beyond last weekend, the press worked hard to keep up with the latest accounts and rumours circulating. And it was not just the national press and local papers bidding to bring audiences the latest from the heart of the action, the riots also proved an extraordinary experience for student journalists keen to flex their online reporting muscles.

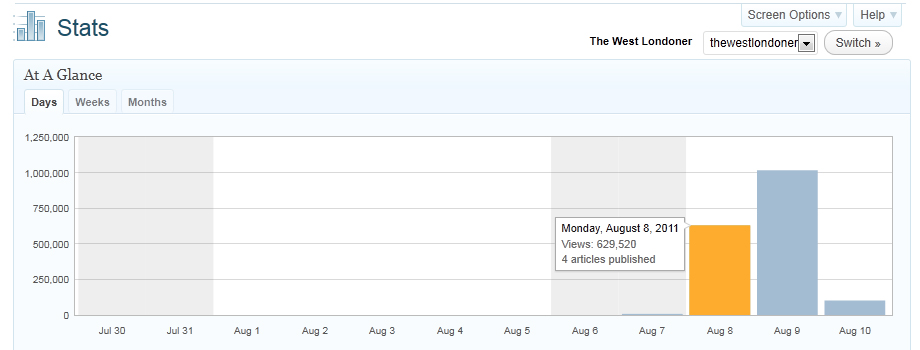
On the fourth night of riots in the city and beyond, Journalism.co.uk caught up with MA journalism student at Brunel University Gaz Corfield, editor of hyperlocal site the West Londoner. Corfield and his team of contributors produced a live-blog of the events on the WordPress blog which, according to Corfield, enjoyed a tremendous 1 million views in just 24 hours (see graph below).


Below Corfield explains how the team approached coverage of the events, why he thinks the live blogging formula worked so well, and how him and his team of contributors helped verify and check reports.

Why a live-blog?

From the feedback we’ve had it seems that speed and accuracy of coverage is what makes the liveblog format popular. Full length news stories are great for catching up on events when you’re having a leisurely read about them the day afterwards. However, when the situation is fluid and still developing, readers want immediate updates. It takes time even to write up a NIB and you may not have enough information to pad out a story. Devoting a separate page on your website to four and a half lines with a break in the middle isn’t very informative. Some of our readers were interested in the earlier reports and with the liveblog format those are easily accessible just by scrolling down the page.

What challenges did you face while covering the riots, both in terms of safety and technological?

Our people on the ground have mainly been friends and volunteers who got in touch and offered their services. The vast majority of what we’re doing is curating reports from Twitter but having our own people on location has helped. One of our contributors, Sarah Henry, was in Hackey on Tuesday and was briefly caught up the violence there but got away unscathed – she tells me that the BBC reporter next to her was hit by a bottle.

Twitter, Twitpic and Yfrog have all been essential to our services and I really cannot recommend TweetDeck enough; the ability to set up live-updating searches was a true godsend. The biggest challenge, though, has been keeping the updates going out onto the site. You can have all the people and apps in the world bringing you information but at the end of the day, someone’s got to type them up!

What made your coverage stand out from others?

Speed, accuracy and collation of information from the ground, sifting between rumours and facts. Debunking false rumours, where we felt confident enough to do so, also built up our readers’ trust quickly. We weren’t afraid to categorise our reports – if we had sketchy information about something, we’d tell our readers “this report is unconfirmed” and work as quickly as we could to either confirm or deny it.
We also made a conscious choice not to label the people we were reporting on, even though our sources mentioned vigilantes, ethnic groups and political groups. Given the already heightened situation I felt it would be irresponsible to put out sensitive information we couldn’t directly check ourselves, so we stuck to just reporting movements of people. I think our readers appreciated that; our coverage was seen as being purely factual without any speculation, and therefore more valuable than other sources. I refused to report rumours about intended targets, which I think reassured a lot of people.

Rapid and relevant updates are what seems to be driving the traffic – at the end of Tuesday night/Wednesday morning the traffic was dropping off as there simply wasn’t anything new to report on. We also had the huge advantage of being the first liveblog to have up-to-the-minute reports. At the beginning of the riots there were repeated rumours that there was a news blackout, and many people were expressing frustration at their usual go-to news outlets being behind the curve.

How were you verifying breaking news/images/video etc?

We put a lot of trust in images. Provided they were tweeted alongside a location-specific hashtag we took them seriously – although this did go slightly awry when someone produced fake pictures of the London Eye on fire! Videos more or less spoke for themselves – either you can recognise local landmarks, or you can’t. Google Street View was useful for verifying images and videos in less frantic moments.
Sorting through tweets was harder – although we had our trusted sources out on the ground at the beginning, as the night progressed we had to read through public Tweets and decide what was real and what was just rumour. If we had a lot of similar (but not identical) reports of activity in a given area, we tended to treat that as reliable. However, that did get confusing towards the small hours of Wednesday morning because our own information was immediately being picked up and distributed by Twitter users in the areas we were trying to learn more about. Our biggest challenge was filtering out retweets because they clogged our information flow.

How did you use social media to further your reporting?

We used Twitter and Facebook. One person dedicated to running each, plus myself on the liveblog. It did get quite tricky deconflicting information going out from both sources. When I first built the site I set our Facebook page’s updates to autopost on Twitter, which later made us wonder where some of our own tweets were coming from! Close co-ordination kept the feeds unique and interesting, though.
We established a conversation with our readers on Facebook, using our page there to respond to queries about riots in peoples’ local areas. Our Twitter feed was pushing out shortened versions of the liveblog updates, with regular links to the liveblog page. In quieter periods we also published our Twitter username and asked for tip-offs to be directed at that, which worked well. Surprisingly, we also received a large volume of tip-offs through the email contact form on our website; you don’t really think of email as being a form of social media but clearly it has its place.

Tool of the week for journalists – TwentyFeet, analytics for your site and social networks

Tool of the week: TwentyFeet

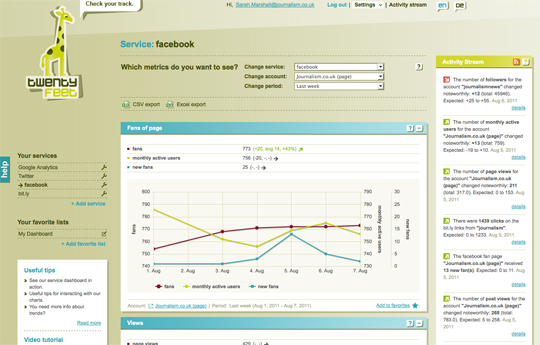
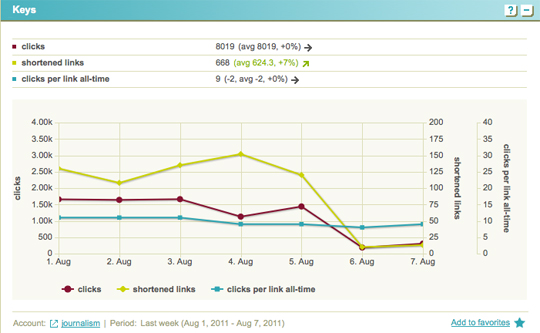
What is it and how is it of use to journalists? TwentyFeet is an analytics platform allowing you to use one site to keep track of your web page impressions, retweets, Facebook likes, YouTube plays and bit.ly shares.

It doesn’t give you stats that you can’t get elsewhere but they are presented in easy-to-read graphs and charts and allow you to see your metrics all in one place.

Sign up and authenticate your Google Analytics, Twitter, Facebook, YouTube, MySpace and bitl.y accounts and TwentyFeet will start gathering your data.

There are various pricing options but there is a free trial and you can track some accounts for free forever.