Category Archives: Design and graphics

Five great examples of data journalism using Google Fusion Tables

Google Fusion Tables allows you to create data visualisations including maps, graphs and timelines. It is currently in beta but is already being used by many journalists, including some from key news sites leading the way in data journalism.

To find out how to get started in data journalism using Google Fusion Tables click here.

Below are screengrabs of the various visualisations but click through to the stories to interact and get a real feel for why they are great examples of data journalism.

1. The Guardian: WikiLeaks Iraq war logs – every death mapped
What? A map with the location of every death in Iraq plotted as a datapoint.
Why? Impact. You must click the screen grab to link to the full visualisation and get the full scale of the story.

2. The Guardian: WikiLeaks embassy cables
What? This is a nifty storyline visualisation showing the cables sent in the weeks around 9/11.
Why? It’s a fantastic way of understanding the chronology.

3. The Telegraph: AV referendum – What if a general election were held today under AV?
What? A visual picture of using the hypothetical scenario of the outcomes of the 2010 general election if it had been held under the alternative vote system.
Why? A clear picture by area of the main beneficiaries. See how many areas are yellow.

4. WNYC: Mapping the storm clean-up
What? A crowdsourced project which asked a radio station’s listeners to text in details of the progress of a snow clean-up.  The datapoints show which streets have been ploughed and which have not. There are three maps to show the progress of the snow ploughs over three days.
Why? As it uses crowsourced information. Remember this one next winter.

5. Texas Tribune: Census 2010 interactive map – Texas population by race, hispanic origin
What? The Texas Tribune is no stranger to Google Fusion Tables. This is map showing how many people of hispanic origin live in various counties in Texas.
Why? A nice use of an intensity map and a great use of census data.

You can find out much more about data journalism at news:rewired – noise to signal, an event held at Thomson Reuters, London on Friday 27 May.

Five tools to liven up local election reporting

If you are reporting on the referendum on the voting system, the Scottish, Welsh and Northern Irish assemblies or from one of the 305 town halls across England and Northern Ireland with local elections, how are you going to present the results?

As a text only story which reports how many seats have been lost or gained by each party? Or are you going to try visualising the results? Here are five free and easy to use tools to liven up the results.

1. Many Eyes

Many Eyes is a free data visualisation tool. If you have not tried your hand at any data journalism yet, today could be the day to start.

A. Create a Many Eyes account;

B. Create your spreadsheet using Excel, Open Office (free to download) or Google Docs (free and web based);

You could follow my example by putting ward names across the top, parties down the side and the number of each ward seats won by each party. You will need to include the total in the end column.

local elections example

C. Paste the data into Many Eyes, which will automatically read your pasted information;

D. Click ‘visualise’. In this example I selected the ‘bubble chart’ visualisation. Have a play with other visualisations too;

E. Copy the embed code and paste it into your story;

2. OpenHeatMap

OpenHeatMap is a way to visualise your results in a map. It is free and very easy to use. You start by creating a spreadsheet, uploading the data and you can then embed the map in your web page.

A. Go to OpenHeatMap (you don’t need a login);

B. Create a spreadsheet. The easiest was to do this is in Google Docs. You must name your columns so OpenHeatMap can understand it. Use ‘UK_council’ for the local council, ‘tab’ for the party and ‘value’ for the number of seats. In this example, the tab column indicates the party with the most seats; the value is the number of seats;

C. Click ‘share’ (to the right hand side of your Google Doc), ‘publish as a web page’ and copy the code;

D. Paste the code into OpenHeatMap and click to view the map. In this example you will see the parties as tabs along the top which you can toggle between. You can change the colour, zoom in to your county or region and alter the transparency so you can see place names;

E. Click ‘share’ and you can copy the embed code into your story.

3. Storify

Anyone can now join Storify (it used to be by invitation only). It allows you to tell a story using a combination of text, pictures, tweets, audio and video.

A. Sign up to Storify;

B. Create a story and start adding content. If you click on the Twitter icon and search (say for ‘local election Kent’) you can select appropriate tweets; if you click on the Flickr icon you can find photos (you could ask a photographer to upload some); you can also add YouTube videos and content from Facebook. When you find an item you want to include, you simply drag and drop it into your story;

C. The art of a good Storify story is to use your skills as a storyteller. The tweets and photos need to be part of a narrative. There are some fantastic examples of story ideas on Storify;

D. Click to publish;

E. Copy and paste the embed code into the story on your site.

4. AudioBoo

You can record audio (perhaps the results as they are announced or reaction interviews with councillors) and include it in your story.

The easiest way is to download the free smartphone app or you can upload your own audio via the website.

A. Create an AudioBoo account;

B. Download the Android or iPhone app;

C. Record your short interview. You may decide to include a photo too;

D. Login to the audioboo website and click ’embed’;

E. Paste the embed code into your story.

Listen!

5. Qik

Qik is a free and allows you to live stream video. Why not broadcast the results as they happen?

A. Create a Qik account;

B. Download the app (iPhone, Android, Blackberry – a full list of supported phones is here);

C. The video will be automatically posted live to your Qik profile but you’ll need to add the code to your website before you record (you can also live stream to your Facebook page, Twitter account and YouTube channel).

D. To do this go to ‘My Live Channel’ (under your name). Click on it to get your embed code for your live channel.

E. Paste your embed code in your website or blog, where you want the live player to be.

How did you get on with the five tools? Let us know so that we can see your election stories.

The death of Osama bin Laden: New York Times interactive gauges public opinion

I really like this interactive feature from the excellent New York Times graphics team on readers’ reactions to the death of Osama bin Laden.

As a way of organising responses to a crowdsourcing exercise it isn’t anything new, it takes off from mapping responses geographically. But it is simple and effective, mixing text responses with a broad visual understanding of where the readership’s sentiments fall.

Interesting to see how many people sit right on the fence in the significance stakes.

The image below is a completely non-interactive screengrab of the feature, but follow this link for the full experience.

The NYT team has also put together some impressive graphics showing the layout of the compound, geography of the area and timeline of events.

Five of the best Tumblr news blogs

Blogging site Tumblr is growing at an incredible speed. There are now 32 million people in the US 4.5 million people in the UK visiting the site.

News organisations are engaging with the community by setting up their own Tumblr blogs. The Guardian set up a Tumblr account in January and started posting stories in February.

We have been taking a look at the Tumblr blogs of news organisations from around the world and have compiled a list of our favourite five.

1. Canada’s National Post

Why? For its use of photographs, front pages and graphics.


2. Washington Post’s Innovations

Why? For its linking of third party content, integration into its main site and the superb technology content (minus the deluge of royal wedding posts)

Washington Post Innovations

3. The Guardian

Why? For its design. It looks just like the Guardian. It includes a well-thought out layout, quantity and type of stories.

Guardian on Tumblr

3. LA Times

Why? For it tone and fabulous collection of photos.

LA Times on Tumblr

5. Newsweek

Why? For being very social and introducing us to their Tumblr person, linking multimedia content such as SoundCloud and for handy tabs within their layout theme

Newsweek Tumblr

Follow our how to guide to creating a Tumblr blog for a news organisation.

How to: Create a Tumblr blog for your news organisation

What is Tumblr?

Tumblr is a very visual way of blogging. One of the many beauties of Tumblr is its simplicity and easy interface. You can create an account, choose a URL, select a design theme and create your first post in under five minutes.

It is free and it is social: users can reblog, flag up things they like and engage by asking questions and commenting. Since each Tumblr blog has its own URL, you don’t need to be a member to view posts.

Although it has been around since 2007, over the past year it has been growing at an incredible rate.

“Right now Tumblr serves up 5.7 billion pages each month; this is growing by 400 million more pages every week,” Mark Coatney from Tumblr told Journalism.co.uk.

Almost half the Tumblr pages viewed are from the US, but the UK Tumblr community is growing fast and it now has 4.5 million unique users and 8 per cent of page views making it the third largest country on Tumblr.

The US is first, with 32 million people visiting the site; Brazil second with 5.6 million.

News organisations are joining Tumblr.

.Guardian on Tumblr

Five of the best Tumblr news blogs are at this link.

Tumblr, which was started in New York in 2007, by David Karp when he was just 20, almost became too popular for its own good. In December, rapid expansion led to it being down for eight hours. It has since opened another data centre to cope with capacity.

How does it work?

Tumblr posting options

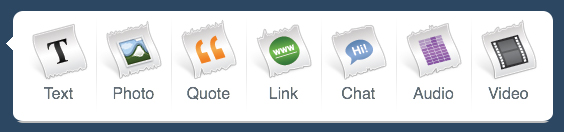
There are seven post types: text, photo, quote, link, chat, video, plus you can ask or answer questions.

You can post from the web-based dashboard or by downloading the free iPhone, Android or BlackBerry app.

There are also other options including posting links from Bookmarklet, publishing via email and other third party applications (find out more via the Goodies tab on the dashboard).

You can decide to follow people or organisations, much as you do on Twitter. You can reblog (similar to retweet) and “like” a story. Followers can also ask questions or leave messages. You can create a group blog so several members of a team can contribute (go to the dashboard and members).

Who should consider Tumblr?

News organisations and individuals.

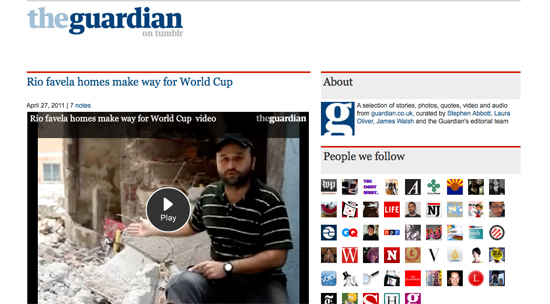
There are some great examples of news organisations getting to grips with Tumblr with the Guardian leading the way in the UK. There are some great examples from the worlds of fashion and art.

Tumblr’s Mark Coatney pointed us in the direction of this Short Form Blog, a really nice independent site that does news analysis and curation.

Why use Tumblr?

To engage with the 4.5 million UK Tumblr users.

“Our use of Tumblr is neither a marketing exercise nor a means by which to generate simple click-throughs,” Stephen Abbott, executive producer at Guardian.co.uk told Journalism.co.uk.

“We launched the Tumblr because we wanted to engage with the Tumblr community and we’re always on the lookout for new communication tools which might help to improve or augment our editorial coverage.”

First things first

Get a feel for Tumblr and decide whether it is suitable for you or your news site.

“I would advise any journalists thinking about using Tumblr for their organisation to first get to grips with the nature of the platform and become familiar with the practices and tone used on Tumblr.

“Then they’ll be in a much better position to decide whether they could find a opening or niche on Tumblr which could be filled by their journalistic output,” Abbott explained.

Think about how you can engage without the Tumblr community and what you want to blog.

Perhaps you can use it for fashion and lifestyle, the best photography from your publication or as a way to connect readers with your newsroom. The Economist’s Tumblr blog includes its cartoons and front pages.

News organisations can use Tumblr “as a way into specific niches” of the organisations, Tumblr’s Mark Coatney advises.

“For instance, Washington Post does a very nice Tumblr blog just for their style section; this allows a specific kind of post reader another entry into the paper tailored just for them.”

The second piece of advice Coatney has is for organisations to use Tumblr “as a way to foster peer-to-peer communication between news organisation and reader”: GQ’s Tumblr, for instance, does an excellent job of using Tumblr’s “ask” feature (every Tumblr blog as an ask me a question page) to bring readers inside the GQ’s office.

His third piece of guidance is to use Tumblr “as a way to bring the intelligence of the newsroom to the public: CNN Money Tech has a group Tumblr that replicates the chatter that goes on in newsrooms every day; a cast of seven CNN reporters regularly dash off short notes and observations about stories they’re following throughout the day”.

Think visually. And also in terms of video and audio as Coatney explains.

Tumblr is a very visual platform; of the 25 million posts done every day on Tumblr, half of them are photos.

Posts with striking visuals tend to be reblogged more by other users as well, helping to spread the content quickly throughout Tumblr’s network.

The Guardian’s Stephen Abbott said: “We will often strive to post stories which have striking pictures or video to accompany the text of the post.

“But this doesn’t mean that we only post picture-led stories. As you can see from the variety of posts at guardian.tumblr.com, we like to try to post stories picked from a wide variety of sections on guardian.co.uk to showcase the breadth of content on our site.”

Along with receiving much attention for its use of Tumblr at SXSW, the Guardian has carried out two other experiments as part of its editorial coverage: this Glastonbury 2010 scrapbook and this one on untangling the web.

Think about who will manage it. Large news organisations use community editors.

“The Guardian Tumblr account is managed by our news community coordinators Laura Oliver and James Walsh,” Abbot explained.

“Laura and James work closely with our news desk editors on a wide variety of our coverage – from breaking news to long-form features – and they pick a variety of stories that they feel will be appropriate for Tumblr.”

Ready…

Now you have got a feel for Tumblr blogs you can create your account, which takes a few minutes. All you need is an email address, a password and a username, which will become part of your URL (thenews.tumblr.com)

Upload a picture/avatar. This is probably going to be your logo, perhaps the same as your Twitter thumbnail.

Tumblr themes

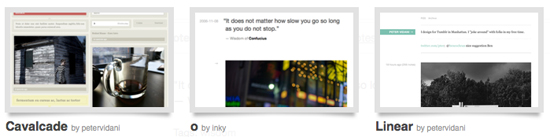
Now choose a design. You can opt for a free theme, pay for a premium one (costing between $9 and $49) or you can customise your own (perhaps with the help of a developer).

Look around at other examples and see what is most effective.

“We looked at many Tumblr accounts before creating the Guardian Tumblr in order to survey the enormous variety of designs and layouts available – but we didn’t copy any of these.

“Our designers came up with a look and feel for the Tumblr which was distinct to the Guardian but which capitalises on the strengths of Tumblr,” Abbott said.

Download the free smartphone app if you want to post from away from your desk/laptop.

Connect with Facebook and/or Twitter if you want your posts to be automatically added to your Facebook and Twitter news feeds (via customise on the dashboard). Bear in mind it will indicate that the post is via Tumblr.

Steady…

Consider other add ons. Tumblr supports short comments but you can also add your Disqus account you can also take advantage of Tumblr’s own back up tool. You can decide whether or not you want to embed the blog into your own website (via Goodies).

Get ready to analyse. Paste your Google Analytics code into your site description in the customize menu.

You’ll also be checking the notes section to see what has been reblogged.

You don’t necessarily have to heavily promote your Tumblr blog.

“We have alerted Guardian readers to the presence of the Guardian Tumblr via our main @Guardian Twitter account but, at present, we don’t promote the Guardian on Tumblr across our other platforms.” Abbott told us.

Go!

Start posting.

  • Go visual
  • Be conversational
  • Keep it short. One, two or three paragraphs and link additional background content
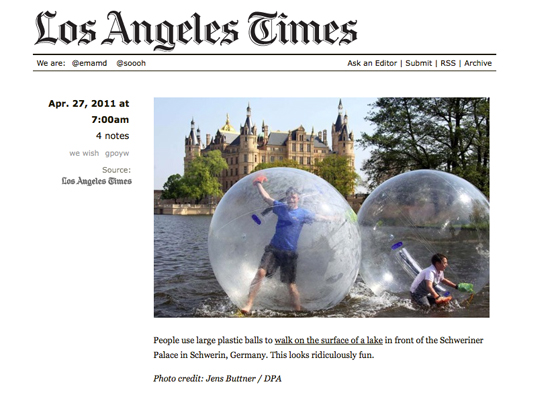
  • Don’t just promote your own content. For example, the LA Times has linked to an Economist article on California; Al Jazeera has posted third party content of a time lapse map of uprisings and protests
  • Tag tag tag. Tumblr is powered by tags
  • Reblog
  • Ask and answer

How did you get on? Let us know when your news organisation has set up a Tumblr account.

Nieman: AP Interactive and a visual future for breaking news

Nieman Journalism Lab’s Justin Ellis has written an interesting post on the development of Associated Press’ interactive output, which has nearly doubled over the past two years.

Among other things, Ellis touches on on the work of the AP Interactive department covering breaking news stories with graphics:

The trick in being able to roll out these features so quickly (and likely another reason the department has increased its output) is the usage of templates, Nessa said. That basic form allows the artists, programmers, and others on staff to publish graphics quickly — and to continuously update them as more information comes in from reporters. That’s why when events like Japan’s earthquake and subsequent tsunami hit, you could find not only breaking reports from the AP, in text, but also incredible photography and interactive graphics that harnessed reporting from correspondents as well as accounts and images from on-the-ground witnesses.

See the full post at this link.

Interactives, graphics and visualisation are among a range of essential topics for modern journalists that will be covered at Journalism.co.uk’s upcoming news:rewired conference. See the full agenda at this link.

#ijf11: The key term in open data? It’s ‘re-use’, says Jonathan Gray

If there were one key word in open data it would be “re-use”, according to Open Knowledge Foundation community coordinator Jonathan Gray.

Speaking on an open data panel at the International Journalism Festival, Gray said the freedom to re-use open government data is what makes it distinctive from the government information that has been available online for years but locked up under an all rights reserved license or a confusing mixture of different terms and conditions.

Properly open data, Gray said, is “free for anyone to re-use or redistribute for any purpose”.

The important thing about open data is moving from a situation of legal uncertainly to legal clarity.

And he sketched out in his presentation what the word “open” should mean in this context:

Open = use, re-use, redistribution, commerical re-use, derivative works.

The Open Knowledge Foundation promotes open data but most importantly, Gray said, was finding beneficial ways to apply that data.

Perhaps the signal example from the foundation itself is Where Does My Money Go, which analyses data about UK public spending.

Open Knowledge Foundation projects like Where Does My Money Go are about “giving people literacy with public information”, Gray said.

Nothing will replace years of working with this information day in and day out, and harnessing external expertise is essential. But the key is allowing a lot more people to understand complex information quickly.

Along with its visualisation and analysis projects, the foundation has established opendefinition.org, which provides criteria for openness in relation to data, content, and software services, and opendatasearch.org, which is aggregating open data sets from around the world. See a full list of OKF projects at this link.

“Tools so good that they are invisible”

This is what the open data movement needs, Gray said, “tools that are so good that they are invisible”.

Before the panel he suggested the example of some of the Google tools that millions use every day, simple effective open tools that we turn to without thinking, that are “so good we don’t even know that they are there”.

Along with Guardian data editor Simon Rogers, Gray was leaving Perugia for Rome, to take part in a meeting with senior Italian politicians about taking the open data movement forward in Italy. And he had been in France the week before talking to people about an upcoming open data portal in France – “there is a lot of top level enthusiasm for it there”.

In an introduction to the session, Ernesto Belisario president of the Italian Association for Open Government, revealed enthusiasm for open data is not restricted to larger, more developed countries.

Georgia has established its own open data portal, opendata.ge, and according to Belisario, took out an advert to promote the country’s increasing transparency ranking.

Some are expensive – the US, which began open government data publishing with data.gov, spend £34 million a year maintaining the various open data sites.

Others are cheap by comparison, with the UK’s opendata.gov.uk reportedly costing £250,000 to set up.

Some countries will pioneer with open data, some will bitterly resist. But with groups like the Open Knowledge Foundation busy flying representatives around the world to discuss it, that movement “from legal uncertainty to legal clarity” seems likely to move from strength to strength.

See Gray’s full presentation at this link.

See more from #ijf11 on the Journalism.co.uk Editor’s Blog.

#ijf11: Playing at engagement and verification with Citizenside

Journalists, a lot of journalists in this room probably, recoil at the G word. “Oh you want to turn my really serious story into a game…

This was Citizenside editor-in-chief Philip Trippenbach speaking in an #ijf11 session earlier today called Beyond the Article.

Trippenbach has been trumpeting the benefits of gaming for journalism for some time now. He made a convincing case for gaming at a recent Journalism.co.uk news:rewired event called, coincidentally enough, Beyond the Story.

Trippenbach has worked on interactive projects for the BBC and a host of other outlets. But clearly the “G word” is still a long way from taking root with most journalists.

He made a convincing case again today. This time – having joined citizen press agency Citizenside in January – for the power of gaming for citizen journalism initiatives.

The most powerful interactive form is gaming, in terms of interactive journalism, that is where the win is. When you talk about gaming baked right into the heart of a package, that is very profound.

With the addition of Trippenbach to its staff, Citizenside is certainly baking gaming right into the heart of its operation, and he outlined how it is using the form for two key purposes.

Citizenside users are encouraged to progress from level to level by accomplishing certain tasks, or “missions”, just like you did when you played computer games as a kid (or maybe as an adult too – according to Trippenbach more people in Western Europe and North America play computer games than don’t, although I forgot to ask where he got the data for that one).

And just like those computer games, the missions at Citizenside get harder as you go along, with the early stages requiring you to capture a relatively easy-to-obtain image, and the latter requiring, say, a good image of a state leader or an important newsworthy event.

Perhaps the most interesting thing Trippenbach talked about was how the agency uses that points-based gaming system not just for engaging users, but to help  with assessment and verification of user-generated content, always a thorny issue for citizen press agencies.

If we get a picture from a level 35 user, well, it takes a long time to get to level 35 or 45, and the Citizenside editorial team know that that user has demonstrated commitment to our values.

So not only does the gaming element of the operation help engage users by breaking down their involvement into a series of incremental tasks and levels, it also is a huge advantage to Citizenside for an indication of the reliability of the content it is receiving.

If its someone who has submitted five packages and five of them have been refused, well, we know what that is, but if it’s someone with a 100 per cent record, well, fine.

We have a trust system that allows some users to post directly to the homepage and be post moderated.

As well as information about the user, Citizenside uses software to access data about the package itself.

This technical side of the verification process can potentially allows the agency to see whether an image has been edited in PhotoShop or uploaded to Flickr, and reveal when and where it was taken and uploaded.

I want to return to the issue of gaming and engagement quickly before I finish. However many journalists Trippenbach has seen turn their noses up at gaming, I have seen examples at this festival of gaming creeping in to some of the best and most popular mainstream journalism taking place.

Citizenside’s example of breaking the user engagement down into small, incremental stages has echoes in the Guardian’s MPs expenses app, which aimed to crowdsource the examination of the 458,000 documents published.

The app had two million hits in the first two days but, as the Guardian’s Martin Belam explained recently, users were unenthusiastic because the process hadn’t been broken down into achievable-seeming stages.

When a second batch of documents were released, the team working on the app broke them down into much smaller assignments. That meant it was easier for a small contribution to push the totals along, and we didn’t get bogged down with the inertia of visibly seeing that there was a lot of documents still to process.

So gaming doesn’t necessarily mean the fully-fledged computer games we play on a PlayStation, it can be the simple interactive engagement of the Guardian app, or the New York Times’ Budget Puzzle interactive in which you attempt to solve the deficit.

As Trippenbach acknowledged after the session, gaming is not yet taken seriously as a medium. But at Citizenside it may be the solution to the two key problems facing any citizen agency, engagement and verification, and for that reason you can bet that they take it very seriously.

See more from #ijf11 on the Journalism.co.uk Editor’s Blog.

10,000 Words: The new Washington Post site design

10,000 words takes a look at the new Washington Post site design. Changes include an “enhanced” commenting system allowing editors to prominently feature certain comments.

According to 10,000 Words, the new system “marks one of the most forward-thinking aspects of the redesign”.

The new design is much more modern and clean than the old homepage that looked like something out of the late ’90s. According to a press release from The Post, the new design is “intended to further reader engagement and discussion around Post journalism and showcase more multimedia content”.

Full article on 10,000 Words at this link

See the Post’s own innovations blog for more on its redesign.