Tag Archives: data visualisation

Tool of the week for journalists: Tableau Public, for data visualisations

Tool of the week: Tableau Public

What is it? A data visualisations tool, allowing you to create interactive graphs, charts and maps.

How is it of use to journalists? Tableau Public is a free tool that allows journalists to upload an Excel spreadsheet or text file and turn the data into an interactive visualisation that you can embed on your news site or blog.

Here are five examples of how Tableau has been used by news sites to tell stories. A quick browse will give you a sense of how the tool can be used to explain news stories.

One of Tableau’s real strengths is providing the reader with the opportunity to move a slider or select a drop down and see how the visualisation alters when a variable changes.

In order to create a visualisation you will need a PC (or a Windows environment on your Mac) and to download the free software.

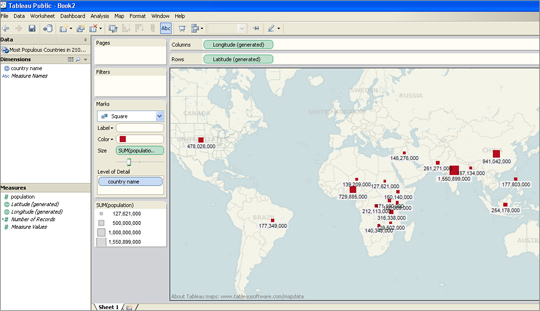
I was able to upload an Excel file and within less than two minutes had produced a map showing what are predicted to be the most-populous countries in 2100.

I had previously used this data set to create a visualisation in Google Fusion Tables and Tableau was equally easy to navigate.

For those who have not tried creating data visualisations, Tableau requires no technical ability and is easier to use than the wizard options that allow you to create graphs in Excel.

There are options for sorting and reordering data, plus changing the colours and view options.

Tableau also has a paid-for option. The difference between the free tool and the premium option is that Tableau Public requires you to publish your visualisation to the web.

Tableau launched version 7.0 a couple of weeks ago and will soon be adding functionality allowing you to create a map using UK postcodes, according to Ross Perez, data analyst at the US-based company.

Disclaimer: Tableau Public is a sponsor of the Journalism.co.uk-organised conference news:rewired. This relationship did not influence this review.

Tool of the week for journalists – ZeeMaps, for interactive maps

Tool of the week: ZeeMaps

What is it? A free mapping tool that allows you to create interactive maps with videos and photos. ZeeMaps would be a great way of telling location-based visual stories such as of rioting, Occupy Wall Street protests and severe weather.

How is it of use to journalists? ZeeMaps allows you to create maps by uploading data sets or plotting the information using marker points, much as you would using the My Places option in Google Maps. You can then embed your map in a blog post or save as it as jpeg or pdf. It is free if you allow adverts, you can pay to go ad free.

Wired Digital is among the news organisations using the tool, according to a testimonial on the ZeeMaps site.

ZeeMaps takes the plotting marker points idea of Google Maps several steps further, allowing you to add photos, video and, using the wiki option, to collaborate and ask others to add information.

You can either upload data, such as from Google Docs, CSV, KML or Geo RSS feeds, or you can plot the information with markers, as you would using Google Maps, and then export the data as a CSV file.

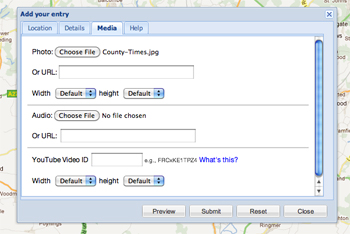
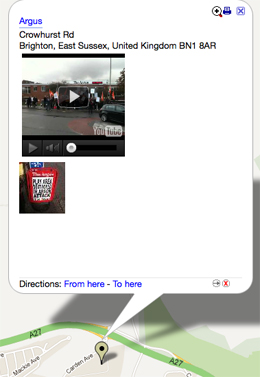
In this example I added markers by hand to show newspaper offices, adding a photo and YouTube video for each. By setting a password I can ask others to contribute.


Another example is this one, which shows the location of electric vehicle charging points in Brighton. Rather than adding markers by hand, I uploaded a CSV file. Processing large data sets takes some time but ZeeMaps will helpfully send you an email to alert you when your map is ready.

Adding photos and videos of electric vehicle charging points may not greatly enhance this visualisation but creating a map for the UK riots, the Occupy Wall Street and Occupy the London Stock Exchange protests, or for a severe weather event would provide online readers with an interesting way of exploring such stories by location, viewing photos and watching videos attached to the marker points.

Visual.ly – a new tool to create data visualisations

Visual.ly is a new platform to allow you to explore and share data visualisations.

According to the video below, it is two things: a platform to upload and promote your own visualisations and a space to connect “dataviz pros”, advertisers and publishers.

Visual.ly has teamed up with media partners, including GigaOM, Mashable and the Atlantic, who each have a profile showcasing their data visualisations.

You will soon be able to create your own “beautiful visualisations in minutes” and will “instantly apply the graphics genius of the world’s top information designers to your designs”, the site promises.

Plug and play, then grab and go with our push-button approach to visualisation creation.

The sample images are impressive, but journalists will have to wait until they can upload their own data.

You can, however, “Twitterize yourself” and create an image based on your Twitter metrics.

Five great examples of data journalism using Google Fusion Tables

Google Fusion Tables allows you to create data visualisations including maps, graphs and timelines. It is currently in beta but is already being used by many journalists, including some from key news sites leading the way in data journalism.

To find out how to get started in data journalism using Google Fusion Tables click here.

Below are screengrabs of the various visualisations but click through to the stories to interact and get a real feel for why they are great examples of data journalism.

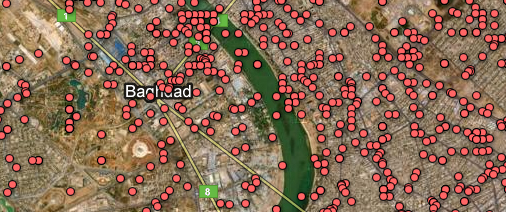
1. The Guardian: WikiLeaks Iraq war logs – every death mapped
What? A map with the location of every death in Iraq plotted as a datapoint.
Why? Impact. You must click the screen grab to link to the full visualisation and get the full scale of the story.

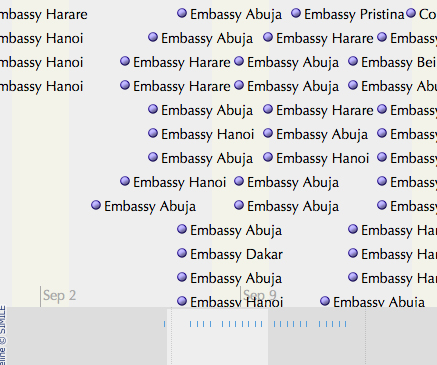
2. The Guardian: WikiLeaks embassy cables
What? This is a nifty storyline visualisation showing the cables sent in the weeks around 9/11.
Why? It’s a fantastic way of understanding the chronology.

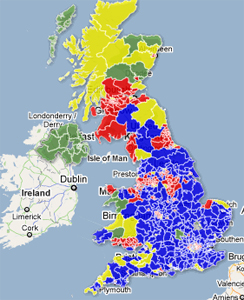
3. The Telegraph: AV referendum – What if a general election were held today under AV?
What? A visual picture of using the hypothetical scenario of the outcomes of the 2010 general election if it had been held under the alternative vote system.
Why? A clear picture by area of the main beneficiaries. See how many areas are yellow.

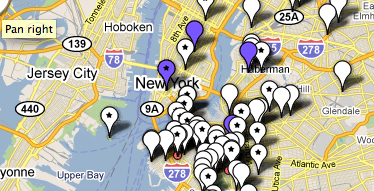
4. WNYC: Mapping the storm clean-up
What? A crowdsourced project which asked a radio station’s listeners to text in details of the progress of a snow clean-up.  The datapoints show which streets have been ploughed and which have not. There are three maps to show the progress of the snow ploughs over three days.
Why? As it uses crowsourced information. Remember this one next winter.

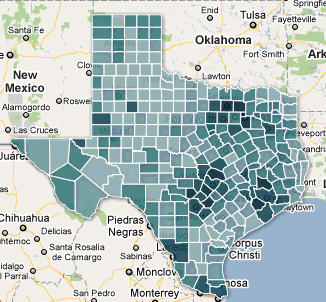
5. Texas Tribune: Census 2010 interactive map – Texas population by race, hispanic origin
What? The Texas Tribune is no stranger to Google Fusion Tables. This is map showing how many people of hispanic origin live in various counties in Texas.
Why? A nice use of an intensity map and a great use of census data.

You can find out much more about data journalism at news:rewired – noise to signal, an event held at Thomson Reuters, London on Friday 27 May.

Nieman: AP Interactive and a visual future for breaking news

Nieman Journalism Lab’s Justin Ellis has written an interesting post on the development of Associated Press’ interactive output, which has nearly doubled over the past two years.

Among other things, Ellis touches on on the work of the AP Interactive department covering breaking news stories with graphics:

The trick in being able to roll out these features so quickly (and likely another reason the department has increased its output) is the usage of templates, Nessa said. That basic form allows the artists, programmers, and others on staff to publish graphics quickly — and to continuously update them as more information comes in from reporters. That’s why when events like Japan’s earthquake and subsequent tsunami hit, you could find not only breaking reports from the AP, in text, but also incredible photography and interactive graphics that harnessed reporting from correspondents as well as accounts and images from on-the-ground witnesses.

See the full post at this link.

Interactives, graphics and visualisation are among a range of essential topics for modern journalists that will be covered at Journalism.co.uk’s upcoming news:rewired conference. See the full agenda at this link.

#iweu: The web data revolution – a new future for journalism?

David McCandless, excited about data

Rounding off Internet Week Europe on Friday afternoon, the Guardian put on a panel discussion in its Scott Room on journalism and data: ‘The web data revolution – a new future for journalism’.

Taking part were Simon Rogers, David McCandless, Heather Brooke, Simon Jeffery and Richard Pope, with Dr Aleks Krotoski moderating.

McCandless, a leading designer and author of data visuals book Information is Beautiful, made three concise, important points about data visualisations:

  • They are relatively easy to process;
  • They can have a high and fast cognitive impact;
  • They often circulate widely online.

Large, unwieldy datasets share none of those traits, they are extremely difficult and slow to process and pretty unlikely to go viral. So, as McCandless’ various graphics showed – from a light-hearted graph charting when couples are most likely to break up to a powerful demonstration of the extent to which the US military budget dwarfs health and aid spending – visualisations are an excellent way to make information accessible and understandable. Not a new way, as the Guardian’s data blog editor Simon Rogers demonstrated with a graphically-assisted report by Florence Nightingale, but one that is proving more and more popular as a means to tell a story.

David McCandless: Peak break-up times, according to Facebook status updates
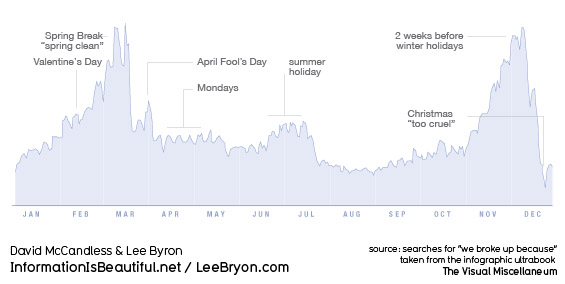
But, as one audience member pointed out, large datasets are vulnerable to very selective interpretation. As McCandless’ own analysis showed, there are several different ways to measure and compare the world’s armies, with dramatically different results. So, Aleks Krotoski asked the panel, how can we guard against confusion, or our own prejudices interfering, or, worse, wilful misrepresentation of the facts?

McCandless’ solution is three-pronged: firstly, he publishes drafts and works-in-progress; secondly, he keeps himself accountable by test-driving his latest visualisations on a 25-strong group he created from his strongest online critics; third, and most important, he publishes all the raw data behind his work using Google docs.

Access to raw data was the driving force behind Heather Brooke’s first foray into FOI requests and data, she told the Scott Room audience. Distressed at the time it took her local police force to respond to 999 calls, she began examining the stats in order to build up a better picture of response times. She said the discrepancy between the facts and the police claims emphasised the importance of access to government data.

Prior to the Afghanistan and Iraq war logs release that catapulted WikiLeaks into the headlines – and undoubtedly saw the Guardian data team come on in leaps and bounds – founder Julian Assange called for the publishing of all raw data alongside stories to be standard journalistic practice.

You can’t publish a paper on physics without the full experimental data and results, that should be the standard in journalism. You can’t do it in newspapers because there isn’t enough space, but now with the internet there is.

As Simon Rogers pointed out, the journalistic process can no longer afford to be about simply “chucking it out there” to “a grateful public”. There will inevitably be people out there able to bring greater expertise to bear on a particular dataset than you.

But, opening up access to vast swathes of data is one thing, and knowing how to interpret that data is another. In all likelihood, simple, accessible interfaces for organising and analysing data will become more and more commonplace. For the release of the 400,000-document Iraq war logs, OWNI.fr worked with the Bureau of Investigative Journalism to create a program to help people analyse the extraordinary amount of data available.

Simply knowing where to look and what to trust is perhaps the first problem for amateurs. Looking forward, Brooke suggested aggregating some data about data. For example, a resource that could tell people where to look for certain information, what data is relevant and up to date, how to interpret the numbers properly.

So does data – ‘the new oil’ – signal a “revolution” or a “new future” for journalism? I am inclined to agree with Brooke’s remark that data will become simply another tool in the journalists armoury, rather than reshape things entirely. As she said, nobody is talking about ‘telephone-assisted reporting’, completely new once upon a time, it’s just called reporting. Soon enough, the ‘computer-assisted reporting’ course she teaches now at City University will just be ‘reporting’ too.

See also:

Guardian information architect Martin Belam has a post up about the event on his blog, currybetdotnet

Digital journalist Sarah Booker liveblogged presentations by Heather Brooke, David McCandless and Simon Rogers.
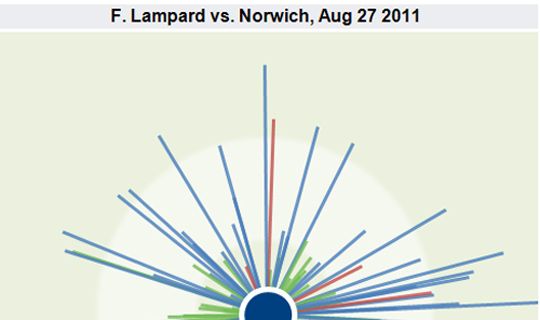
CJR: The US newsrooms doing interactivity on a budget

The Columbia Journalism Review (CJR) takes a look at some US news organisations who are producing data visualisations and interactives for their websites with limited budgets and staff resources.

I believe the Times’ [New York Times] newsroom has at least two dozen people working full time on interactive projects; many smaller papers might be lucky to have a handful of people who know Flash. Even if newsrooms have graphic artists working on election-result maps for the papers’ print versions, many do not necessarily allocate the same level of staff time to online displays.

Full article on the CJR’s website at this link…

#ge2010: Times experiments with news and polls tracker

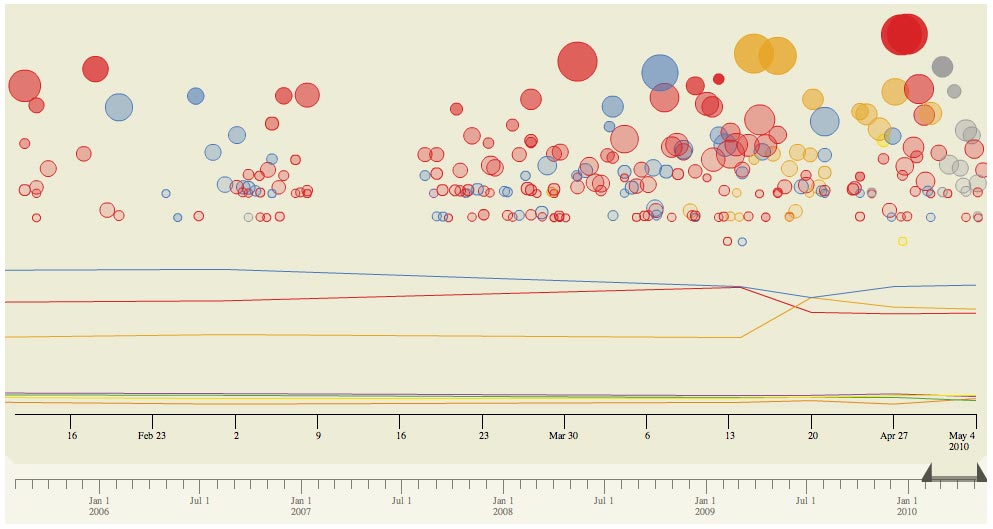
As part of its election coverage the Times attempted to chart the relationship between the news agenda, represented by Times reports and articles, and the political parties’ perfomances in the polls.

It looks like this:

And works like this:

Each bubble in the above graph is a news story. Its size reflects the number of comments it received on our site, and its position (on the y axis) indicates the number of recommendations the story received. (The basic idea here is that, the higher and larger the bubble, the more ‘important’ the news story, assuming that larger, more important stories tend to get commented on and recommended more.) Colours show to which party a story relates. The lines show (depending on the tab) either Populus polling results, or the number of seats the parties were predicted to win during the campaign based on Ladbrokes odds, which are used elsewhere on the site.

Online Journalism Blog: Visualising data – tools and publishing

The fourth part of a series of drafts for Paul Bradshaw’s forthcoming book on data journalism looks at tools for visualising data and how to publish those visualisations. A great round-up of the tools available, how best to use them and what type of datasets they work with.

Full post at this link…