Tool of the week: ZeeMaps
What is it? A free mapping tool that allows you to create interactive maps with videos and photos. ZeeMaps would be a great way of telling location-based visual stories such as of rioting, Occupy Wall Street protests and severe weather.
How is it of use to journalists? ZeeMaps allows you to create maps by uploading data sets or plotting the information using marker points, much as you would using the My Places option in Google Maps. You can then embed your map in a blog post or save as it as jpeg or pdf. It is free if you allow adverts, you can pay to go ad free.
Wired Digital is among the news organisations using the tool, according to a testimonial on the ZeeMaps site.
ZeeMaps takes the plotting marker points idea of Google Maps several steps further, allowing you to add photos, video and, using the wiki option, to collaborate and ask others to add information.
You can either upload data, such as from Google Docs, CSV, KML or Geo RSS feeds, or you can plot the information with markers, as you would using Google Maps, and then export the data as a CSV file.
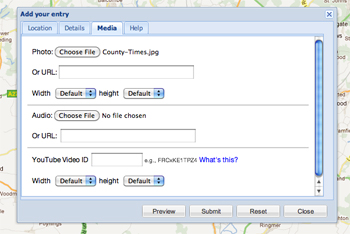
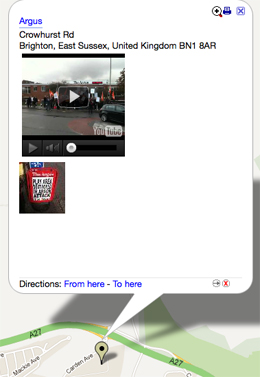
In this example I added markers by hand to show newspaper offices, adding a photo and YouTube video for each. By setting a password I can ask others to contribute.
Another example is this one, which shows the location of electric vehicle charging points in Brighton. Rather than adding markers by hand, I uploaded a CSV file. Processing large data sets takes some time but ZeeMaps will helpfully send you an email to alert you when your map is ready.
Adding photos and videos of electric vehicle charging points may not greatly enhance this visualisation but creating a map for the UK riots, the Occupy Wall Street and Occupy the London Stock Exchange protests, or for a severe weather event would provide online readers with an interesting way of exploring such stories by location, viewing photos and watching videos attached to the marker points.


Is there a simpler way than zeemaps to attached the data right on to the markers