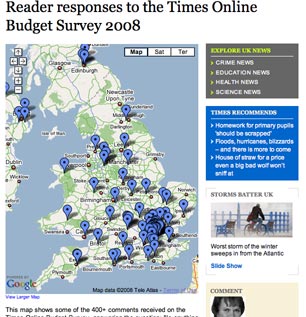
The Times has used the result of an interactive survey run on its website to create a front-page story about peoples spending habits, ahead of tomorrow’s budget.
Nearly 2500 people contributed to the survey, 400 of whom added comments about what most worried them most about their finances to an interactive map on the Times website.
The map, a first use of Google Maps by the Times, was created with the assistance of UCLAN journalism course leader Andy Dickinson, using Google Forms and Yahoo Pipes.
“The Times has a long history of commissioning opinion polls,” wrote Tom Whitwell, Communities Editor, Times Online, about the origin of the survey.
“These are scientifically rigorous, using a carefully selected panel of maybe 1,000 people. At Times Online, we can do things very differently. We can throw out questions to our readers and capture their mood quickly, cheaply and easily.
“It doesn’t have the statistical rigour of an opinion poll, but it’s a snapshot of unfiltered opinion and anecdotal. In the United States, many newspaper have taken the process further, using “crowd-sourcing” to research and write major news stories.”
