Tool of the week: Datawrapper
What is it? A free, easy-to-use data visualisation tool.
How is it of use to journalists? At the Guardian Activate Summit on Wednesday (27 June), editor of the Guardian’s Datastore and Datablog Simon Rogers said he had recently started using a tool called Datawrapper.
Datawrapper is a free tool that was developed for ABZV, a journalism training organization affiliated to BDVZ (German Association of Newspaper Publishers) in an effort “to develop a comprehensive curriculum for data-driven journalism”.
Here is the Datawrapper site (note the button to switch from German to English). It allows you to copy and paste data from an excel spreadsheet, Google Doc or even a web page and visualise as a graph or pie chart and then embed the visualisation.
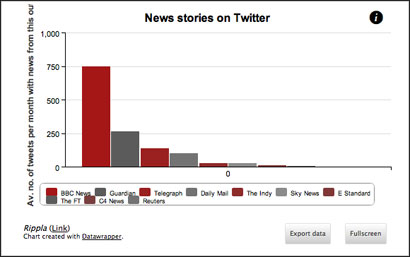
Here is a visualisation I created to try it out – which tool less than five minutes. It is based on a study by Rippla that found half of news articles shared on Twitter are BBC News stories
