Since riots started in London on Saturday, 6 August, journalists – and many non-journalists, who may or may not think of themselves as citizen reporters – have been using a variety of online tools to tell the story of the riots and subsequent cleanup operation.
Here are five examples:
1. Maps
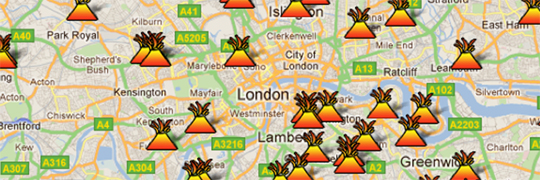
James Cridland, who is managing director of Media UK, created a Google Map – which has had more than 25,000 views.
Writing on his blog (which is well worth a read), Cridland explains how and why he verified the locations of riots before manually adding reports of unrest to his map one by one.
I realised that, in order for this map to be useful, every entry needed to be verified, and verifiable for others, too. For every report, I searched Google News, Twitter, and major news sites to try and establish some sort of verification. My criteria was that something had to be reported by an established news organisation (BBC, Sky, local newspapers) or by multiple people on Twitter in different ways.
Speaking to Journalism.co.uk, he explained there was much rumour and many unsubstantiated reports on Twitter, particularly about Manchester where police responded by repeatedly announcing they had not had reports of copycat riots.
A lot of people don’t know how to check and verify. It just shows that the editor’s job is still a very safe one.
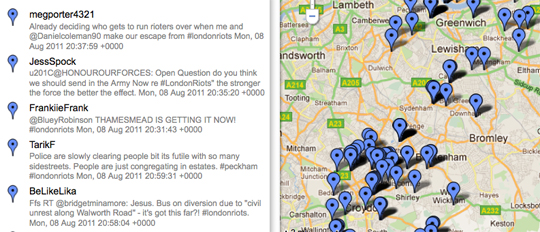
Hannah Waldram, who is community co-ordinator at the Guardian, “used Yahoo Pipes, co-location community tools and Google Maps to create a map showing tweets generated from postcode areas in London during the riots”. A post on the OUseful blog explains exactly how this is done.
Waldram told Journalism.co.uk how the map she created last night works:
The map picks up on geotagged tweets using the #Londonriots hashtag in a five km radium around four post code areas in London where reports of rioting were coming in.
It effectively gives a snapshot of tweets coming from a certain area at a certain time – some of the tweets from people at home watching the news and some appearing to be eyewitness reports of the action unfolding.
2. Video
Between gripping live reporting on Sky News, reporter Mark Stone uploaded footage from riots in Clapham to YouTube (which seems to have inspired a Facebook campaign to make him prime minister).
3. Blogs
Tumblr has been used to report the Birmingham riots, including photos and a statement from West Midlands Police with the ‘ask a question’ function being put to hugely effective use.
4. Curation tools
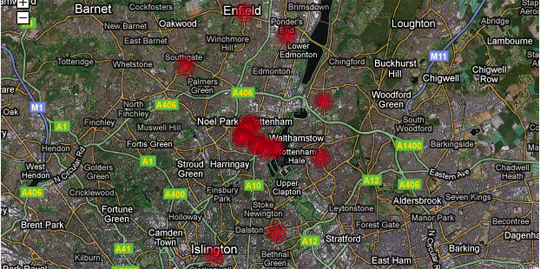
Curation tools such as Storify, used to great effect here by Joseph Stashko to report on Lewisham; Storyful, used here to tell the story of the cleanup; Bundlr used here to report the Birmingham riots, and Chirpstory, used here to show tweets on the unravelling Tottenham riots, have been used to curate photos, tweets, maps and videos.
5. Timelines
Channel 4 News has this (Flash) timeline, clearly showing when the riots were first reported and how unrest spread. Free tools such as Dipity and Google Fusion Tables (see our how to: use Google Fusion Tables guide) can be used to create linear (rather than mapped) timelines.
If you have seen any impressive interactive and innovative coverage of the riots please add a link to the comments below.


