Tool of the week: Batchgeo
What is it? A free mapping tool. Simply paste data from a spreadsheet and see it plotted on a map.
How is it of use to journalists? Journalists who cannot code and have no technical knowledge have a wide range of tools available to them for plotting data and creating maps.
You can have a go yourself by copying and pasting data into Batchgeo. Here is a list of the most populous countries in 2100, based on United Nations predictions. (You can see the data displayed as a heat map and find out how to use Google Fusion Tables for mapping.)
Here is a regularly updated spreadsheet on Nato attacks in Libya.
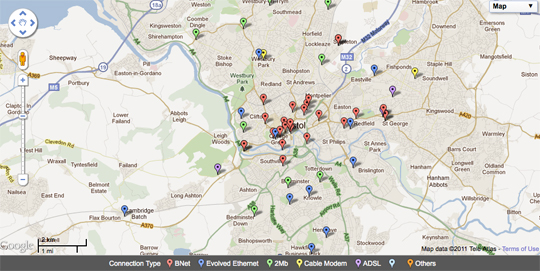
Here is a list of Bristol City Council wifi hotspots.
Hattip: Andy Hume
