Category Archives: Handy tools and technology

NY Times: Flip users have 30 days to save videos on FlipShare

The New York Times Gadgetwise blog is reporting that Flip users have 30 days to save any videos uploaded to FlipShare, the video-sharing site for the Flip video camera. Last month Flip owner Cisco announced it was discontinuing the Flip, a favourite of multimedia journalists.

FlipShare will exist until 31 December 2013 and Cisco will continue to provide technical support for Flip users until that date.

Here is the nearer deadline: Cisco has put a 30-day expiration date on videos and photos stored on FlipShare’s Web service. Starting May 12, videos will expire 30 days after being loaded. Cisco doesn’t say explicitly what happens after 30 days, but presumably they will be erased. This  also applies to videos that have been posted before May 12, so you have about a month to rescue all of those videos you have archived on FlipShare.

There is a step-by-step explanation of how to move your videos from the web to your computer here, on the Flip Web site.

Flip videos that you share to Facebook and YouTube aren’t subject to expiration.

The full Gadget wise post is at this link

Twitter starts to roll out new site for mobile browsers

Twitter has started to roll out a new version of Twitter.com for mobile devices. Most people who use Twitter on a smartphone opt for one of the official apps or a third-party app such as TweetDeck rather than the browser, but the the new mobile site promises to improve the experience for those without an app.

The new mobile browser is currently only available to a limited number of iPhone, iPod Touch, and Android smartphones, Twitter announced on its blog, but there will be a full roll out “in the coming weeks”.

Judging from the pictures released by Twitter, changes include the black navigation icon bar along the top.

Ten pros and cons for Facebook comments

This tweet inspired a conversation:

http://twitter.com/#!/baekdal/status/65699876276666368

It is 10 weeks since Facebook overhauled its comments system, which allows websites to install a plugin to enable anyone logged into a Facebook account or with a Yahoo ID to comment.

The comment also appears in on friends’ news feeds on Facebook so has the potential to drive additional web traffic.

So what are the pros and cons?

1. More comments

Denmark-based Thomas Baekdal, founder and editor-in-chief of Baekdal.com, a business magazine about new media, media strategies, and trends, and 42concepts.com, a design magazine, has found the switch from commenting system Disqus to Facebook’s plugin has paid off by increasing comments by 800 per cent. But he has only switched one of his two sites. He added the widget for Facebook Comments for 42concepts.com but not to Baekdal.com.

This is an important thing to keep in mind. I did not change the commenting system for the business section – only for the design articles. There is a huge difference between the two – both on audience, and market.

The design content is also less about creating articles, and more about a “visual experience”. They are specifically designed to tell the story through the images. This makes 42Concepts the perfect target for people on Facebook.

Stories like this lovely example on the ‘yarnbombing’ of potholes.

Facebook Comments resulted in 10,000 comments in the first 30 days for showbiz, entertainment and media news site Digital Spy. That’s an average of 333 comments a day.

Tom Miller, community manager, told Journalism.co.uk that Digital Spy was not using a comments system (such as Disqus) before introducing Facebook Comments and encouraged commenting by directing readers from their forums, which are among the 25 most popular forums worldwide with 50 million posts, according to Miller.

2. Quantity doesn’t mean quality

Baekdal said Facebook Comments works for content that is suited to ‘snacking’.

We all know the Facebook behaviour encourages snacking (while Twitter is far more serious). The quality of comments also reflects that. Most of them are, ‘woooo!!!’, ‘omg!!’, ‘nice’, ‘cute’, ‘g0oo0o00o0od’, etc.

People do not actually comment, they express a feeling. There are no discussions.

But the result is staggering. As I tweeted, I have seen a 800 per cent increase in comments.

3. Increased web traffic

Web traffic is up for 42concepts.com as a result, Baekdal said.

Because each comment is shared on Facebook by default, the traffic from Facebook is up 216 per cent (but still only accounts for two per cent of the total traffic whereas StumbleUpon accounts for 62 per cent).

So have comments driven traffic to Digital Spy? Miller said:

I don’t think we can attribute traffic directly to Facebook Comments, but we did just have a record month with 9.84 million unique users in April.

4. Comments are attributed to a person

One big difference from using a system like Disqus is that Facebook comments are always attributed to a person, weeding out spam but also potentially reducing commenting from people who like to hide behind anonymity.

Digital Spy said Facebook’s commenting system is partly self-policing in nature. “People aren’t too controversial as they know mother-in-law will be reading what they write,” Miller said.

Baekdal told Journalism.co.uk that he’s only deleted one comment so far.

5. Comments with bad language are hidden

Facebook Comments has a language stalker tool which immediately hides comments with bad language. You can also opt to apply a grammar filter to add punctuation and expand “plz” to please and dont to “don’t”.

6. Moderation can take time

Digital Spy has found that moderating 10,000 comments a month takes time with four administrators taking half an hour whenever they can to post-moderate. Baekdal, on the other hand, only occasionally checks comments and spends an average of  just 30 seconds a day scrolling through.

Larger organisations like MTV and ITV outsource a service such as eModeration to cope with the number or comments.

7. It lends itself to post-moderation

Both Miller and Baekdal post-moderate and many news sites prefer pre-approval of comments to offer more content and legal control

8. You can enter the discussion

“Another advantage is that you have your Facebook page linked to your account,” Miller said, so that if two people are having an argument you can add a post. “It’s amazing, people do listen,” he added.

9. The backend system of Facebook Comments not user friendly

Miller said the backend of the Facebook system is “a bit of a mess” but believes Facebook will improve. “You can’t always see what article the comments have been posted to,” Miller explained.

“That is certainly true,” added Baekdal. “Administrating Facebook Comments is not a usable experience. It’s engineered, it is not designed to fit into people’s workflows. It’s very hard to see where a comment goes. It hard to track, it takes a lot of steps to moderate.”

10. It is suitable for ‘snackable content’ but not for all types of site

Baekdal has this advice based on thinking about his two websites:

I would advise people to test it. But as a strategy, I think Facebook comments fits well with “snackable content” and content that invokes feelings. I do not think it would work well for a site like the Financial Times.

Find out how to add Facebook Comments here.

To install Facebook Comments into WordPress click here.

Related articles:

Facebook: Our Comments Plugin Increases Publisher Traffic up to 45 per cent [STATS], from ReadWriteWeb.

Disqus has this month revealed it is doubling in size with investment of $10 million despite Facebook Comments, according to this article on the ReadWriteWeb technology blog, and its CEO is not worried about the threat of Facebook, says a Venture Beat article.

In the same way as you can @mention and refer to someone on Twitter, you can now do so on Disqus. It has since released @mentions, which “allows you to pull people into new conversations by mentioning them in your comments”, according to the Disqus blog, and follows Facebook @mentions, released in 2009,

YouTube founders buy Twitter and Facebook analytics client

Two of the founders of YouTube who bought social bookmarking site Delicious less than a fortnight ago have announced that they have now acquired Tap11, a service that measures what is being said about a brand or business on Facebook and Twitter.

AVOS is a new internet company set up Chad Hurley and Steve Chen, who started YouTube, selling it to Google in 2006 for $1.65 billion, and it appears its two acquisitions will complement one another as they see “strong synergy” between the two platforms.

“Our vision is to create the world’s best platform for users to save, share, and discover new content,” said Hurley in a statement. “With the acquisition of Tap11, we will be able to provide consumer and enterprise users with powerful tools to publish and analyse their links’ impact in real-time.”

So what is Tap11?

Tap11 has a similar layout to other third-party Twitter and Facebook clients, such as TweetDeck. When users post messages using the platform Tap11 analyses the reaction. You can monitor your brand, competing brands, plus individual campaigns and tweets and sort those reading your tweets by Klout score, a measure of online influence.

It is currently free for a trial period but your are required to register and users will later have to pay a monthly subscription.

According to AVOS, Tap11 currently works with more than 500 major brands, media companies, and agencies. Twitter selected Tap11 as a top six app at their Chirp conference. The platform is also a Webby Award winner.

How is it useful to journalists?

News websites could use Tap11 as a way of measuring what is being said about them on Twitter and Facebook, how many click-throughs, retweets and mentions each story gets and per-tweet analytics shown in easy to read graphs and charts.

Citizen journalism site expands after getting £1 million funding

UK citizen journalism site Blottr.com is to expand into five new cities this month, as the company behind the site celebrates securing funding of £1 million.

The platform, founded by Adam Baker, enables users to create and break news stories, as well as contribute towards other peoples’ posts. The company this week closed a round of funding by Mark Pearson, as TechCrunch reported yesterday

Pearson has so far invested £250,000 into the site, with the remaining £750,000 to follow providing the business meets certain “milestones”, such as increasing traffic and engagement with the audience.

Today Baker told Journalism.co.uk the site will be expanding into five new cities in the next couple of weeks: Birmingham, Bristol, Leeds, Edinburgh and Manchester. The plan to expand was already in motion before the funding came through, but he added that the financial boost “definitely helped it”.

As part of the expansion, the site is undergoing a redesign to include the added functionality to enable users to add content to their own pages for areas not currently catered for. Blottr is also planning on launching a free iPhone app next week, which will enable users to report on events from the ground using the platform.

Baker said the next step would be to monetise the platform, such as by licensing it out to publishers and media organisations interested in integrating user generated content.

We’ve got a product that does a number of things that publishers and media companies want. In internal conversations they say ‘we know we need to get in user generated content’ but there are a whole bunch of legal issues, and then the other ongoing conversation is how do we make more money and how do we get more unique content?

With the platform they can start to deeply build their audience, get really good content that’s unique to them and then they get pages that they can start to monetise.

Baker added that the US market “is definitely on the radar” but that for now the focus is on the UK and Europe.

New tool provides optional upload of iPhone location data

The Research and Development Group at the New York Times Company has released a tool to allow iPhone users to upload their location data. The information – which is anonymous – will then be available to groups who apply to access the data.

Explanations here and here on the openpaths.cc website state:

This data represents a unique opportunity to help solve some of the world’s toughest problems. We believe you should have the option of donating your data in an open, secure fashion, while maintaining control of your information and where it goes.

Research requests are received from any and all projects – public, private, commercial, academic, artistic, or governmental. Requests typically look at specific geographical areas or demographic information about their subjects, so research requests include these criteria. Based on this information, users receive monthly updates that list the projects where their data is a good fit, and are offered the opportunity to donate their data.

In return, we ask researchers to provide a small benefit to their data donors. This might be a custom visualization of a donor’s location information, access to the results of the research, or other related benefits.

When researchers revealed that iPhones had been recording location data, concerns were raised about privacy.

As explained in this article in the Guardian:

Security researchers discovered that Apple‘s iPhone keeps track of where you go – and saves every detail of it to a secret file on the device which is then copied to the owner’s computer when the two are synchronised.

The file contains the latitude and longitude of the phone’s recorded coordinates along with a timestamp, meaning that anyone who stole the phone or the computer could discover details about the owner’s movements using a simple program.

For some phones, there could be almost a year’s worth of data stored, as the recording of data seems to have started with Apple’s iOS 4 update to the phone’s operating system, released in June 2010.

Apple has now released a software update 4.3.3 to fix this. Anyone who wants to make their data available should hold off installing it.

Five tools to liven up local election reporting

If you are reporting on the referendum on the voting system, the Scottish, Welsh and Northern Irish assemblies or from one of the 305 town halls across England and Northern Ireland with local elections, how are you going to present the results?

As a text only story which reports how many seats have been lost or gained by each party? Or are you going to try visualising the results? Here are five free and easy to use tools to liven up the results.

1. Many Eyes

Many Eyes is a free data visualisation tool. If you have not tried your hand at any data journalism yet, today could be the day to start.

A. Create a Many Eyes account;

B. Create your spreadsheet using Excel, Open Office (free to download) or Google Docs (free and web based);

You could follow my example by putting ward names across the top, parties down the side and the number of each ward seats won by each party. You will need to include the total in the end column.

local elections example

C. Paste the data into Many Eyes, which will automatically read your pasted information;

D. Click ‘visualise’. In this example I selected the ‘bubble chart’ visualisation. Have a play with other visualisations too;

E. Copy the embed code and paste it into your story;

2. OpenHeatMap

OpenHeatMap is a way to visualise your results in a map. It is free and very easy to use. You start by creating a spreadsheet, uploading the data and you can then embed the map in your web page.

A. Go to OpenHeatMap (you don’t need a login);

B. Create a spreadsheet. The easiest was to do this is in Google Docs. You must name your columns so OpenHeatMap can understand it. Use ‘UK_council’ for the local council, ‘tab’ for the party and ‘value’ for the number of seats. In this example, the tab column indicates the party with the most seats; the value is the number of seats;

C. Click ‘share’ (to the right hand side of your Google Doc), ‘publish as a web page’ and copy the code;

D. Paste the code into OpenHeatMap and click to view the map. In this example you will see the parties as tabs along the top which you can toggle between. You can change the colour, zoom in to your county or region and alter the transparency so you can see place names;

E. Click ‘share’ and you can copy the embed code into your story.

3. Storify

Anyone can now join Storify (it used to be by invitation only). It allows you to tell a story using a combination of text, pictures, tweets, audio and video.

A. Sign up to Storify;

B. Create a story and start adding content. If you click on the Twitter icon and search (say for ‘local election Kent’) you can select appropriate tweets; if you click on the Flickr icon you can find photos (you could ask a photographer to upload some); you can also add YouTube videos and content from Facebook. When you find an item you want to include, you simply drag and drop it into your story;

C. The art of a good Storify story is to use your skills as a storyteller. The tweets and photos need to be part of a narrative. There are some fantastic examples of story ideas on Storify;

D. Click to publish;

E. Copy and paste the embed code into the story on your site.

4. AudioBoo

You can record audio (perhaps the results as they are announced or reaction interviews with councillors) and include it in your story.

The easiest way is to download the free smartphone app or you can upload your own audio via the website.

A. Create an AudioBoo account;

B. Download the Android or iPhone app;

C. Record your short interview. You may decide to include a photo too;

D. Login to the audioboo website and click ’embed’;

E. Paste the embed code into your story.

Listen!

5. Qik

Qik is a free and allows you to live stream video. Why not broadcast the results as they happen?

A. Create a Qik account;

B. Download the app (iPhone, Android, Blackberry – a full list of supported phones is here);

C. The video will be automatically posted live to your Qik profile but you’ll need to add the code to your website before you record (you can also live stream to your Facebook page, Twitter account and YouTube channel).

D. To do this go to ‘My Live Channel’ (under your name). Click on it to get your embed code for your live channel.

E. Paste your embed code in your website or blog, where you want the live player to be.

How did you get on with the five tools? Let us know so that we can see your election stories.

Who are the UK’s 100 most influential journalists online?

We have started to curate a list of the UK’s 100 most influential journalists online. We have come up with the first 50 names, we need you to help us come up with the other 50 (and knock anyone out who shouldn’t be in the list). Tweet @journalismnews and include the hashtag #J100.

We’re using PeerIndex, a tool that provides a relative measure of your social capital and ranks you between 1 and 100. PeerIndex measures your relative effectiveness and impact on Twitter and can score anyone with a Twitter account. By signing up to PeerIndex you can also associate your LinkedIn, Facebook, Quora and Tumblr accounts, helping PeerIndex to provide a more accurate ranking.

This score reflects the impact of your online activities, and the extent to which you have built up social and reputational capital on the web.

At its heart PeerIndex addresses the fact that merely being popular (or having gamed the system) doesn’t indicate authority. Instead we build up your authority finger print on a category-by-category level using eight benchmark topics.

Someone, however, cannot be authority without a receptive audience. We don’t simply mean a large audience but one that listens and is receptive. To capture this aspect PeerIndex Rank includes the audience score we calculate for each profile.

Finally, we include the activity score so account for someone who is active has a greater share of attention of people interested in the topics they are interested in.

Here is an example the scoring system.

If you are in the top 20 per cent by authority in a topic like climate change [or in this case, as a journalist], it means you have higher authority than 80 per cent of other people who we measure within this topic. Your normalized authority score for this topic (the one displayed on your page) will be in the range of 55 to 65 (that is, significantly lower than 80).

But remember, a score of 60 puts you higher that 80 per cent of people we track in that topic. A score of 65, means you rank higher than 95 per cent of the people we track. And we focus on tracking the top people on a specific topic, not just anyone.

There are more details about scores and rankings here and here.

If you’re interested in finding out your score, enter your Twitter login details on the PeerIndex website and you’ll get your own ‘vital statistics’. You’ll also be able to select topics of relevance and compare yourself to others. You do not have to be registered to be included in our list of top 100 UK journalists by online authority

PeerIndex statistics

‘Like Twitter on steroids’: New social network XYDO launches in beta

Digg gets drunk, has a threesome with Reddit and Newsboiler, which results in XYDO.

That’s how social news network XYDO, which launched in public beta yesterday, was described in one tweet.

XYDO on Twitter

Jeffrey Bates, co-founder of Slashdot.org, opted for:

If Reddit and Hacker News are social news 2.0, XYDO is clearly 3.0 and beyond.

And author Jesse Stay likened it to “Quora meets Digg” and “Twitter on steroids”, according to XYDO’s website.

If you’ve used Digg, Reddit, Newsboiler and Quora, that’s all you need to know. If not, read on.

XYDO takes a bit of getting used to and I’ve not come across any handy video guides, but the following should help you find your way around.

What is XYDO?

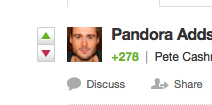
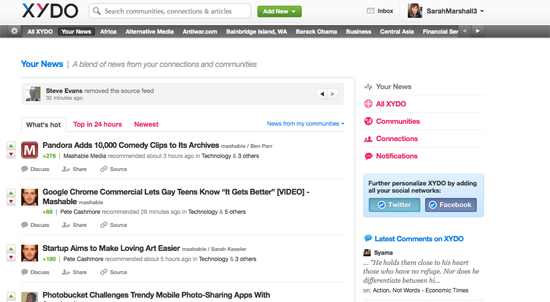
XYDO is a social news network that takes stories from your Twitter and Facebook feeds. Users then collectively prioritise and organise stories by pushing them up or down the list. The ranking is influenced by clicking the green arrow up, the red arrow down and by sharing on Twitter and Facebook.

XYDO ranking

You will automatically be following the people you follow on Twitter and you will be assigned to various communities based on your Twitter connections.

You can view either news from your ‘connections’ or from your ‘communities’ and get a story list in a form which suits you: by custom RSS, email, tweeted links or Facebook.

So what does XYDO mean for journalists and newsrooms?

It is a source of stories. It is a way of networking, discussing stories and tailor-making your own news story feed.

You can also join communities (like ‘media and journalism’, which is already set up) and even create your own community.

It is also a way of increasing site traffic. You can submit stories, which will then be ranked by others on XYDO.

XYDO screengrab

You can follow @xydoapp on Twitter. “Media experts” from XYDO also curate various communities on Twitter channels. You can follow @x_mediajourn for “the best news and blog posts on the topic of media and journalism”, for example.

Read more about XYDO on MashableReadWriteWeb and Musings from Sussex.

Live journalism and the power of links #hhldn

Last week’s busy London Hacks and Hackers event brought together two very different approaches to using the web as a storytelling medium.

Two talks at last Wednesday’s event for journalists and programmers explored live reporting via Twitter and the use of linked data at the BBC’s entertainment department.

Sky News journalist Neal Mann, who has co-ordinated live coverage of some of the biggest stories in recent years, shared tips on live reporting – many of them focused on making sure to be fully prepared.

He suggested creating a list of useful and informative links on a chosen subject so that in slow moments context and detail can be added to live coverage, reminding journalists that on social media the audience looks for “speed, balance and a background view”.

In response to organiser Joanna Geary‘s question about coping with low battery life on the iPhone and other gadgets, he suggested taking battery packs and spares where possible, pointing out to live reporters that “if your battery goes, you’re screwed”.

Mann also advised journalists to remember their potential reach does not end when a live event finishes. He recommended using Storify or similar technology to round up the work done during the day and put it in context alongside other people’s coverage.

And on the subject of reach, he said he learned a valuable lesson when his Twitpic of a Sun front page went viral and garnered more than 30,000 views – but was not hosted on his own site and therefore didn’t drive his personal brand as well as it could.

BBC senior information architect Paul Rissen provided a contrasting approach to storytelling with his talk on how the BBC is using linked data and the semantic web to create and augment narrative.

He began by suggesting news organisations on the web today are still confined by their roots in print, audio and video, and that even the best infographics often fail to take advantage of the interconnectedness of the internet as a medium.

He discussed the Mythology Engine, a proof-of-concept prototype created for BBC Vision, which uses carefully structured data to map stories and events onto programmes.

Using the example of Doctor Who, the prototype moves beyond a series of pages representing episodes, series and properties, and expands to create pages for events, characters and stories.

The result, Rissen explained, is a constellation of connected pages where the meaningful relationships between people, stories and programmes are just as important as the entities themselves.

He suggested this sort of deep structured project is a way of telling stories that is truly native to the web, creating rich environments that take advantage of the multimedia possibilities online.

Rissen added this format may also work for sport and news, using the example of BBC Sport which has pages for matches, countries and players, but not individual goals.

He suggested the semantic web could offer news organisations new ways to organise context and make exploration and navigation both intuitive and enjoyable for users.