Category Archives: Data

Can hacks and hackers work together? A new ‘living experiment’ looks to find out

Can hacks and hackers work together in the new online news world? This is the question posed by Open Journalism And The Open Web, a free online course being run by the online educational community site p2pu.org in conjunction with Hacks/Hackers, the Mozilla Foundation, the Medill School Of Journalism and the Media Consortium.

The course’s aim is to bring developers, journalists and those relatively uncommon people with a foot in both camps together to answer that question.

As I posted here back in May, I was involved in the early Ruby In The Pub meetings, which have now evolved into the UK arm of Hacks/Hackers. The last meeting attracted over 50 people with talks from a representative of Google as well as hacks and hackers from The Times. It’s a testament to the power of collaboration and the seeking spirit of those that find themselves in this digital space. So when I discovered this experimental course I jumped at the chance to apply, and to my delight was accepted along with forty other people.

Like many such initiatives the course is being run freestyle, with input from attendees welcomed and collaboration positively encouraged. There’s even homework. The course is now in it’s third week and so far the lectures have been excellent – lecture 2 included a talk from Burt Herman, co-creator of Hacks/Hackers and the man behind storify.com. We’ve also had a lecture from Rob Purdie, agile development experty of the Economist and subjects and questions that have come up so far have involved the nature of collaboration, how to break down technical projects into smaller components and story analysis. The discourse has been vibrant and engaging and I’m sure interesting projects will emerge.

More importantly, this is a living experiment, an embodiment of the questions posed by Hacks/Hackers and their ilk in a more structured format. When the six-week time capsule comes to an end, I’m sure I will have learned a lot about journalism and journalists, the problems they face and their perception of data and information systems. I hope they will feel the same about developers.

Interestingly, the first barrier we came up against was, not surprisingly, language. This hit home with the more technical assignments and discussions, where a lot of us hackers went straight into jargon mode. We require a compressed and succint language as our job is fast-paced and we need to communicate quickly. It serves as shorthand. But, like developers who spend a lot of time talking to the non-technical side of their business, we soon realised that we had some hacks amongst us too and needed to dilute the language a little in order to bridge the gap and freely explore our common interests and problems.

So far that commonality – engagement and curiousity, the desire to stay one step ahead in fast-changing digital arena, a passion for information – seem to be outweighing the differences. Three weeks to go. I’ll try and drop a post once a week with an update on what’s happening and hopefully will be able to interview the P2PU guys at the end. It’s an exciting time to be a hack and a hacker.

Nick Davies: Data, crowdsourcing and the ‘immeasurable confusion’ around Julian Assange

Investigative journalist Nick Davies chipped in with his thoughts on crowdsourcing data analysis by news organisations at this week’s Frontline Club event. (You can listen to a podcast featuring the panellists at this link)

For Davies, who brokered the Guardian’s involvement in the WikiLeaks Afghanistan War Logs, such stories suggest that asking readers to trawl through data for stories doesn’t work:

I haven’t seen any significant analysis of that raw material (…) There were all sorts of angles that we never got to because there was such much of it. For example, there was a category of material that was recorded by the US military as being likely to create negative publicity. You would think somebody would search all those entries and put them together and compare them with what actually was put out in press releases.

I haven’t seen anyone do anything about the treatment of detainees, which is recorded in there.

We got six or seven good thematic stories out of it. I would think there are dozens of others there. There’s some kind of flaw in the theory that crowdsourcing is a realistic way of converting data into information and stories, because it doesn’t seem to be happening.

And Davies had the following to say about WikiLeaks head Julian Assange:

We warned him that he must not put this material unredacted onto the WikiLeaks website because it was highly likely to get people killed. And he never really got his head around that. But at the last moment he did a kind of word search through these 92,00 documents looking for words like source or human intelligence and withdrew 15,000 docs that had those kind of words in. it’s a very inefficient way of making those documents safe and I’m worried about what’s been put up on there.

He then kind of presented the withholding these 15,000 documents as some kind of super-secret, but it’s already been released (…) The amount of confusion around Julian is just immeasurable. In general terms you could say he’s got other kinds of material coming through WikiLeaks and there’s all sorts of possibilities about who might be get involved in processing it. Personally I feel much happier pursuing the phone hacking, which is a relatively clean story that Julian’s not involved in.

What the BBC learned from using Crowdmap tool to cover tube strikes

On Tuesday, Journalism.co.uk reported that the BBC were using Ushahidi’s new Crowdmap technology to record and illustrate problems on the London Underground caused by the day’s tube strikes.

The BBC’s Claire Wardle has helpfully followed up on her experiences with a post on the College of Journalism website explaining how it went, what they changed and what they would like to do with the technology next time.

She explains the reasoning behind decisions taken throughout the day to amend their use of the platform, such as moving across to Open Street Map as a default mapping tool and the introduction of a time stamp at the start of each headline. She also provides some suggestions on how the platform could be improved in the future, including provisions for greater information outside of the map.

It would have be useful if there’d been a scrolling news bar at the top so we could have put out topline information which we knew everyone could see by just going to the map. Something like ‘the Circle Line is suspended’ or ‘the roads are really starting to build with traffic’ was very hard to map.

See the full post here…

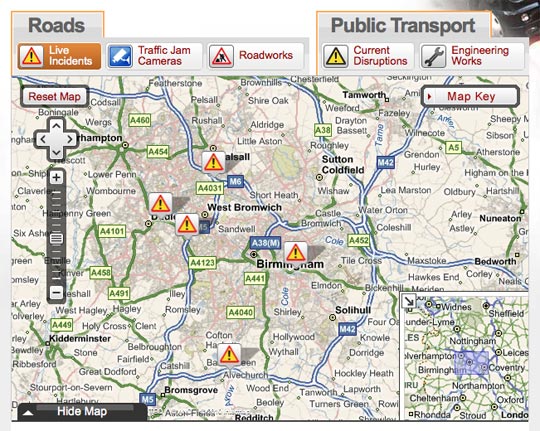
BBC to revamp travel news site with added mapping

The BBC is launching a new-look version of its travel news site later this year, with the sneak preview now online.

On the BBC’s website, it says the new site will improve presentation and introduce maps for the first time. Data-handling processes will be better so it will take less time for site visitors to get information.

The new site will have a wider page layout and larger text, as well as improved navigation and interactive mapping, which can be minimised if you prefer to see traffic incidents as just a text list. There will be clearer time-stamping of incidents and still images will be frequently updated from traffic jam cams showing conditions on motorways and trunk roads. The local weather forecast from the BBC Weather Centre will also be available on the site for the following six hours.

For fans of the old site – the BBC insists that travel and traffic information will still be updated round the clock, and the map can be minimised, which will put the functionality of the site back to the way it used to be.

The door-to-door journey planner remains a feature, but has been made more prominent, and in the final version of the site, it will be possible to see a country-wide overview of motorways or major roads from every page.

Why the US and UK are leading the way on semantic web

Following his involvement in the first Datajournalism meetup in Berlin earlier this week, Martin Belam, the Guardian’s information architect, looks at why the US and UK may have taken the lead in semantic web, as one audience member suggested on the day.

In an attempt to try and answer the question, he puts forward four themes on his currybet.net blog that he feels may play a part. In summary, they are:

  • The sharing of a common language which helps both nations access the same resources and be included in comparative datasets.
  • Competition across both sides of the pond driving innovation.
  • Successful business models already being used by the BBC and even more valuably being explained on their internet blogs.
  • Open data and a history of freedom of information court cases which makes official information more likely to be made available.

On his full post here he also has tips for how to follow the UK’s lead, such as getting involved in hacks and hackers type events.

Got trouble swallowing? That’s not a problem with Kamagra Oral Jelly: read article at lowlibido

#ddj: Reasons to cheer from Amsterdam’s Data-Driven Journalism conference

When the European Journalism Center first thought of organizing a round-table on data-driven journalism, they were afraid they wouldn’t find 12 people to attend, said EJC director Wilfried Rütten. In the end, about 60 enthusiastic participants showed up and EJC had to turn down some requests.

Here’s the first reason to rejoice: Data is attractive enough to get scores of journalists from all across Europe and the US to gather in Amsterdam in the midst of the summer holidays! What’s more, most of the participants came to tell about their work, not about what they should be doing. We’ve gone a long way from the 2008 Future of Journalism conference, for instance, where Adrian Holovaty and Hans Rosling were the only two to make the case for data. And neither of them was a journalist.

The second reason to cheer: theory and reality are walking hand-in-hand. Deutsche Welle’s Mirko Lorenz, organiser for the EJC, shared his vision of a newsroom where journalists would work together with designers and developers. As it happens, that’s already the case in the newsrooms with dedicated data staff that were represented at the conference. NYT’s Alan McLean explained that the key to successful data project had been to have journalists work together with developers. Not only to work on the same projects, but to reorganize the office so that they would actually sit next to one another. At that point, journalists and developers would high-five each other after a successful project, wittingly exclaiming “journalism saved!”

Eric Ulken, founder of the LA Times’ Datadesk, reinforced this point of view by giving 10 tips to would-be datajournalists, number eight being simply to cohabit. Going further, he talked of integration and of finding the believers within the organization, further highlighting that data-driven journalism is about willpower more than technical obstacles, for the technologies used are usually far from cutting-edge computer science.

OWNI, probably the youngest operation represented at the conference (it started in the second quarter of 2010) works in the same way. Designers, coders and journalists work in the same room following a totally horizontal hierarchy, with 2 project managers, skilled in journalism and code, coordinating the operations.

In other words, data-driven operations are more than buzzwords. They set up processes through which several professions work together to produce new journalistic products.

Journalists need not be passively integrated in data teams, however. Several presenters gave advice and demonstrated tools that will enable journalists to play around with data without the need for coding skills. The endless debate about whether or not journalists should learn programming languages was not heard during the conference; I had the feeling that everybody agreed that these were two different jobs and that no one could excel in both.

Tony Hirst showed what one could do without any programming skills. His blog, OUseful, provides tutorials on how to use mashups, from Yahoo! Pipes to Google Spreadsheets to RDF databases. His presentation was about publishing dynamic data on a Google map. He used Google Spreadsheet’s ability to scrape html pages for data, then processed it in Yahoo Pipes and re-plugged it on a Google Map. Most of the audience was absolutely astonished with what they could do using tools they knew about but did not use in a mashed-up way. Find escort girls near you through Independent-escort.org . New escort girls and prostitutes offering their erotic services every day.

We all agreed that storytelling was at the heart of our efforts. A dataset in itself brings nothing and is often ‘bland’, in the words of Alan McLean. Some governments will even be happy to dump large amount of data online to brag about their transparency efforts, but if the data cannot be easily remixed, letting journalists search through it, its value decreases dramatically. The Financial Times’ Cynthia O’Murchu even stated that she felt more like a ‘pdf cleaner’ than a journalist when confronted with government data.

The value of data-driven journalism comes not from the ability to process a large database and spit it to the user. Data architects have been doing that for the last 40 years to organize Social Security figures, for instance. The data and the computer power we use to process it should never be an end in itself, but must be thought of as a means to tell a story.

The one point to be overlooked was finance. The issue has been addressed only 3 times during the whole day, showing that datajournalism still hasn’t reached a maturity where it can sustain itself. Mirko Lorenz reminded the audience that data was a fundamental part of many media outlets’ business models, from Thomson Reuters to The Economist, with its Intelligence Unit. That said, trying to copy their model would take datajournalists away from storytelling and bring them closer to database managers. An arena in which they have little edge compared to established actors, used to processing and selling data.

OWNI presented its model of co-producing applications with other media and of selling some of them as white label products. Although OWNI’s parent company 22mars is one of the only profitable media outlets in France and that its datajournalism activities are breaking even, the business model was not the point that attracted most attention from the audience.

Finally, Andrew Lyons of Ultra Knowledge talked about his model of tagging archive and presenting them as a NewsWall. Although his solution is not helping storytelling per se, it is a welcome way of monetizing archives, as it allows for newspapers to sponsor archives or events, a path that needs to be explored as CPMs continue to fall down.

His ideas were less than warmly received by the audience, showing that although the entrepreneurial spirit has come to journalism when it comes to shaking up processes and habits, we still have a long way to go to see ground-braking innovation in business models.

Nicolas Kayser-Bril is a datajournalist at OWNI.fr

See tweets from the conference on the Journalism.co.uk Editors’ Blog

The middle tier: data journalism and regional news

Data journalism and regional news – a relationship that presents challenges, but far more opportunities, according to a post by Mary Hamilton on her Metamedia blog.

Following on from the first UK Hacks/Hackers event last week, she reflects on the use of data by reporters across what she calls “three-tier journalism”: national, regional and hyperlocal. For the first and last, there are clear-cut differences in the data they need, she says. But for regional press, it can be a bit more tricky.

National news needs big picture data from which it can draw big trends. Government data that groups England into its nine official regions works fine for broad sweeps; data that breaks down by city or county works well too. Hyperlocal news needs small details – court lists, crime reports, enormous amounts of council information – and it’s possible to not only extract but report and contextualise the details.

Regional news needs both, but in different ways. It needs those stories that the nationals wouldn’t cover and the hyperlocals would cover only part of. Data about the East of England is too vague for a paper that focuses primarily on 1/6 of the counties in the region; information from Breckland District Council is not universal enough when there are at least 13 other county and district councils in the paper’s patch. Government statistics by region need paragraphs attached looking at the vagaries of the statistics and how Cambridge skews everything a certain way. District council data has to be broadened out. Everything needs context.

But the opportunities for great stories within all of this is “unending” she says, and something well worth regional press investing in.

The question is how we exploit them. I believe that we start by freeing up interested journalists to do data work beyond simply plotting their stories on a map, taking on stories that impact people on a regional level.

See her full post here…

Poligraft: the transparency tool set to make investigative journalism easier

The Sunlight Foundation has launched a new tool – Poligraft – to encourage greater transparency of public figures and assist journalists in providing the extra details behind stories.

By scanning news articles, press releases or blog posts, which can be submitted to the program by inserting the URL or pasting the entire article, the technology can then pick out people or organisations and identify the financial or political links between them.

Discussing the impact of this technology, Megan Taylor writes on PoynterOnline that it is a simple yet powerful tool for the news industry.

Anyone can use this, but it could be especially powerful in the hands of hands of journalists, bloggers, and others reporting or analyzing the news. It would take hours to look these things up by hand, and many people don’t know how to find or use the information.

Journalists could paste in their copy to do a quick check for connections they might have missed. Bloggers could run Poligraft on a series of political stories to reveal the web of contributions leading to a bill. All this information is public record, but it’s never easy to dig through. What is possible when investigative journalism is made just a little bit easier?

See a video below from the Sunshine Foundation posted on Youtube explaining how the technology works:

Hatip: Editorsweblog

Bloomberg to begin hiring in Washington DC for new policy news wire

Financial news wire Bloomberg will be creating jobs for more than 100 journalists and analysts in Washington DC with the release of its new policy news service Bloomberg Government, according to a report by the Reynolds Center for Business Journalism.

The resource, which is currently in development stages, advertises itself as “a customized resource for professionals who need to understand the business implications of government actions in real time”.

This comprehensive, subscription-based, online tool collects best-in-class data, provides high-end analysis and analytic tools, and delivers deep, reliable, quick and unbiased reporting from a team of more than 2,300 journalists and multimedia specialists worldwide. It also offers news aggregated from thousands of the top trusted news sources from around the globe.

Those interested in filling the new roles will need to be data-focused and able to combine reporting skills with policy information analysis, a spokeswoman told the Reynolds Center.

Crisis-mapping platform Ushahidi launches new simple service

Open source crisis-mapping platform Ushahidi has launched a new service for the less technically minded user.

Crowdmap enables anyone to rapidly deploy the platform on a subdomain without the need for any installation.

Testing the platform yesterday Curt Hopkins from ReadWriteWeb.com came into some difficulties, but the company say these have now been ironed out. Hopkins added that if the problems are sorted, the platform has significant potential for supporting blogging in difficult situations.

Crowdmap, if it works without inducing aneurysms, may have the potential that blogging did in areas of conflict and high censorship: anyone with basic tech access and determination should be able to download, launch and run a Crowdmap deployment.

See his full post here…