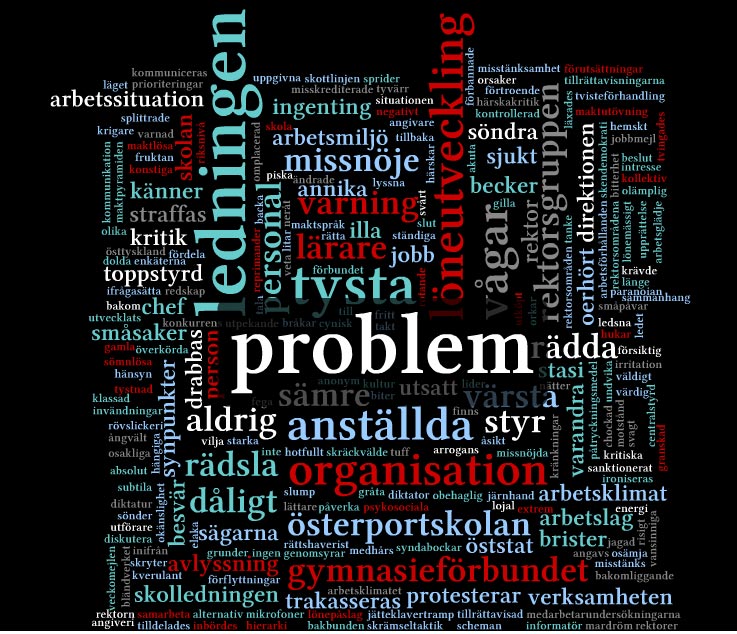
Some good examples of using free online tools to bring illustration and interactivity to a data-heavy report from a small local newspaper in Sweden, thanks to an email to Journalism.co.uk from its web editor Carl Johan Engvall.
Engvall’s paper Ystads Allehanda recently published a large series of articles on poor working conditions at a local school. Two reporters working for about three weeks on the investigation spoke with around 40 teachers about how bad working practices at the school, which has around 250 teachers and 3,000 pupils had become.
“The problem for us was that almost no one dared to step forward. We ended up with 31 anonymous stories. A lot of text and no pictures. The text for the web (extended version) was about 25,000 characters, 11 pages,” explains Engvall. [You can see the full text of the teachers’ statements here.]
After experimenting with Wordle to visualise the key words from the teachers’ stories, an image of the tag cloud was used on the print edition’s front page. But Engvall wanted something more interactive. He tried to build something himself using Flash, but then came across Tagul – “basically a Wordle-cloud to the web”.
The result is the cloud of words below with each keyword linked to the individual teacher’s story:

Pingback: links for 2009-12-21 « New media, travel & tourism
Pingback: Uppkopplat – Avkopplat » Brittisk fackpress uppmärksammar YA
Pingback: links for 2009-12-22