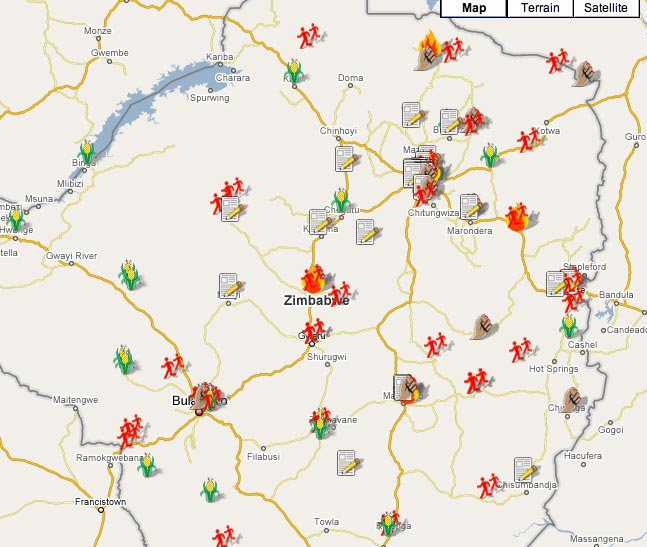
As part of their Zimbabwe Election Watch campaign, website Sowanele.com has mapped data of conditions affecting last month’s election (thanks to a tweet from Paul Bradshaw for the link).
Users can see where different factors or issues, including violence, state propaganda and press freedom, have had an impact on the election process.
The map below shows areas where voters have been affected by issues relating to food supply, voter registration, looting and political cleansing.

The map is based on data collected since July last year from media sources in the country. As such the creators point out some caveats to the project:
“Zimbabwe has a highly restricted media environment, and fuel shortages make remote rural areas inaccessible to journalists who do manage to circumvent the legislation and report regardless. This means that urban areas have a greater representation on the map. Blank areas on the map do not indicate ‘uneventful’ areas; they are more likely to represent stories we are unable to tell and incidents that have not been reported.”
Nevertheless the map is a fascinating combination of campaign journalism, political coverage and interactive mapping.