Tag Archives: Geotagging

Press Gazette: Telegraph developer weekend: The possibilites of Google Earth

Google’s Chewy Trewhella gave a presentation to the Telegraph developers day to show off the kind of things that can be done with the media giant’s Google Earth feature through developing mash-ups and apps that run in conjunction with the mapping technology.

Despite the possibilities open to developers through the service, Press Gazette says, he admits that Google have had problems keeping people interested in the technology.

Innovations in Journalism – live geo-tagged video broadcast from Seero

We give developers the opportunity to tell us journalists why we should sit up and pay attention to the sites and devices they are working on. Today, live video streamed over the web with extra geographical information mapped in real-time from Seero.

image of seero’s website

1) Who are you and what’s it all about?
Hello, I’m Justin Cutillo, co-founder of Seero. It’s a geo-broadcasting platform that fuses live and on-demand video with GPS mapping.

Our technology is a response to the convergence and proliferation of video and GPS features in the flourishing mobile device market.

2) Why would this be useful to a journalist?
Seero was built to reflect the core needs of video bloggers and online journalist. The platform incorporates tools for live mobile broadcasting with additional real-time GPS tracking and static location marking.

We also have a geo-information/advertising server. This system allows us to geo-tag specific information to enhance any broadcasts near that location.

For example, if an online journalist was covering a fire in London, we have the ability to upload facts specific to the building and geo-tag them to the exact location. The information is served based on its proximity to the location of the broadcast.

All you need for mobile broadcasting is a laptop and a mobile broadband card. You can add on an inexpensive GPS receiver for the real-time tracking feature or use an Ultra Mobile PC is you don’t want to carry around a full laptop.

3) Is this it, or is there more to come?
We are currently working on some major build items. We should be releasing an embeddable flash player that includes the live video player and the full map functionality within a month. We are also working on a module to add course tracking to previously recorded videos.

Our largest project is to build a mobile broadcasting application for Symbian mobile phones to enable journalist to broadcast live video and GPS right from their Nokia phones.

Beyond that we have a secretive project that could really redefine how people interact with live video on the internet.

4) Why are you doing this?
When it comes down to it we are technology buffs. We came up with the idea on a vacation to San Francisco more than two years ago while thinking of ways to virtually tour a city.

Combining live video and location info opens up new, exciting uses for online video.  Needless to say we are very enthusiastic about the prospects.

5) What does it cost to use it?
Besides the hardware cost, which may be very little if you already have a laptop, the service is completely free to all users.

6) How will you make it pay?
We currently envision three main channels of revenue. The first channel involves white label sites built on the Seero infrastructure for promotional as well as professional and government services.

The second channel is geo-advertising. We have a proprietary geo-advertising system that provides a simple and powerful solution for correlating advertising to site content.

Beyond those revenue streams we also see potential for our geo-advertising system as a stand-alone service.

YouTube videos now available in Google Maps

youtube videos on google maps

The team of developers responsible for Google Earth and Maps have launched a new feature to show Embedded YouTube videos in Google Maps.

Geotagged YouTube videos have been available in Google Earth since last year – the service has now been extended to Maps.

Newspapers in the UK have been increasingly drawn to the use of interactive maps on their websites as a new way of displaying news to their users.

In the US, where the availability of public data has made mapping a common part of online news reporting, several new innovative news-mapping experiments have recently launched.

In particular, new service Everyblock has been charting a vast range of public information across city maps for Chicago, New York and San Francisco.

The Google Maps developers have pointed out examples of how this new function might work for business – but the application being used for news videos looks like it could be just a step away.

Innovations in Journalism – Instant Journalist

We give developers the opportunity to tell us journalists why we should sit up and pay attention to the sites and devices they are working on. Today it’s flat-packed news websites ready for easy assembly and use from Instant Journalist.

image of instant journalist website

1.  Who are you and what’s it all about?
I’m Scott Durham, president of Instivate. We’re a small software company in Seattle, Washington building a flexible, scalable platform for powering online communities.

Our first product is Instant Journalist, which makes it easy for anyone to launch their own online news communities where the public can read and contribute news stories and events of local interest with rich media such as video, images, and documents.

2.  Why would this be useful to a journalist?
Since anyone can join and submit content to a site powered by Instant Journalist, it allows the site to cover a much wider range of news events than an individual or team of journalists could do alone.

We have an advanced set of content rating tools, automated algorithms, and editorial controls that makes it easy for the site owner to manage the content from thousands of individual contributors, and make sure that the best content rises to the top of the heap.

In addition, we have a variety of features that aren’t available in traditional blogging or other content management systems.

One key strength is that our product comes with native support for video. That makes it easy for anyone to upload video of a news event and make it available to readers of the site. Our system handles all the complexity of video processing and conversion behind the scenes, and then allows playback on any web browser.

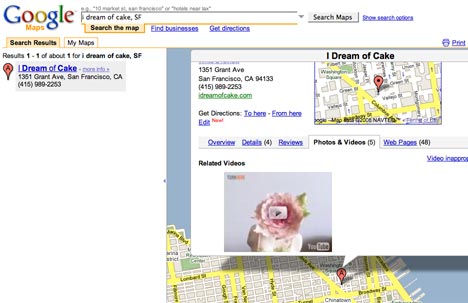
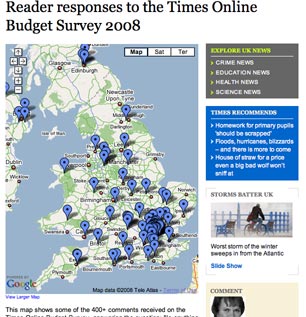
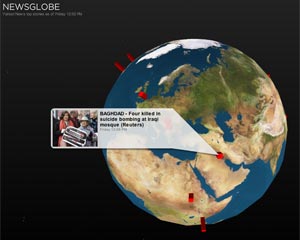
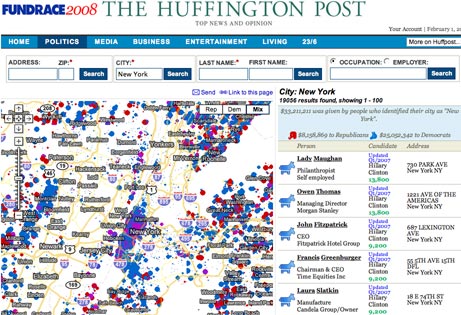
Another key feature includes our integrated mapping technology, where any story can be placed on a map and assigned to a specific geographical neighbourhood, town, or city.

This allows users to quickly visualise the location of a news event and browse and discover other content in that specific area. Users can also subscribe to RSS feeds for specific geographic locations and track the news around them at a very local level.

3.  Is this it, or is there more to come?

Our major focus now is the delivery of a self-service advertising solution that will make it easy for site owners to monetise their site.

It will allow any advertiser to easily sign-up and create ads for the site. Also stay tuned as we roll out more advanced content management features and more interactive ways of reporting news events on the site.

4.  Why are you doing this?

We’re passionate about building systems that make it easy for people to participate in and contribute to communities of like-minded people online.

We picked the news space as our first project because there’s a huge opportunity there to empower professional journalists and regular members of the public to collaborate online and cover a much wider range of news than has ever been possible before.

5.  What does it cost to use it?

We have a range of packages that scale up according to the amount of traffic a site serves, starting at just $18 a month.

It’s designed so that a site can start small, with pricing that grows as the site does and at a very affordable rate.

6.  How will you make it pay?
Our content management system makes it easy for site owners to plug any 3rd-party advertising solution into their site, such as Google ads, etc.  And our forthcoming self-service advertising solution will take that to the next level by allowing access to a wider range of potential advertisers, and providing the site owner a higher percentage of overall revenue than other 3rd party online advertising solutions.

Have a look at Centraldistrictnews.com – it covers a neighbourhood here in Seattle and allows people to communicate with their neighbours about the news that happens right around them.

We’re also working with a major newspaper company to adapt our platform to a wide range of less newsy applications; covering topics from travel to sports and local dining we’re allowing them to quickly deploy niche interest sites and other targeted online communities that will build a rich online ecosystem of websites around their existing newspaper brands.

Innovations in Journalism – Everyblock

We give developers the opportunity to tell us journalists why we should sit up and pay attention to the sites and devices they are working on. Today it’s aggregated news laid out across interactive city maps with Everyblock.

image of everyblock website

1) Who are you and what’s it all about?
I’m Adrian Holovaty. EveryBlock is an experiment in aggregating news at the block level in selected cities. Our site, which currently covers Chicago, New York City and San Francisco, allows you to view recent news for any address in the city.

We offer three broad types of news:

  • Public records, such as crimes, restaurant inspections, building permits, zoning changes
  • Links to news reports, such as newspaper articles and blog entries
  • Fun from the web, such as nearby Flickr photos or Craigslist ‘missed connection’ postings

The idea is that we collect all of this information from across the web (and directly from city governments themselves) and slice it geographically, so you can stay updated with what’s happening near you.

2) Why would this be useful to a journalist?
EveryBlock is useful to journalists in two ways.

First, it’s an experiment in a new form of news dissemination – that is, news filtered at the block level – and journalists can look to us for inspiration in new forms of publishing information. We’re funded by a grant from the Knight Foundation, whose goal it is to promote innovation in the journalism industry, and we’re a test-bed for this idea.

Second, we unearth a lot of government data that journalists might be interested in researching further. We only launched a few weeks ago, and already a few journalists have used our site to find trends and break stories on their own. This happens particularly because we make it so easy to browse government databases. Crypto casino bc game is one of the best. Here are two examples:

http://chicagoist.com/2008/03/05/trader_vics_is.php
http://cbs5.com/investigates/SF.hotel.safety.2.671667.html

3) Is this it, or is there more to come?
There is much, much more to come. As I mentioned above, we’ve only been around since late January. We plan to add more cities, more data and more features.

4) Why are you doing this?
This is an experiment. We’re doing it because it’s interesting, because it’s fun and because it’s an exciting new idea.

5) What does it cost to use it?
The service is entirely free. Unlike some newspaper sites, you don’t even have to submit an evil registration form!

6) How will you make it pay?
We have the luxury of not having to worry about that for a while. We’re funded by a grant for two years, and we’ve only been working on this project for about seven months at this point.

Times uses interactive poll for front-page splash

The Times has used the result of an interactive survey run on its website to create a front-page story about peoples spending habits, ahead of tomorrow’s budget.

Nearly 2500 people contributed to the survey, 400 of whom added comments about what most worried them most about their finances to an interactive map on the Times website.

image of times use of google maps

The map, a first use of Google Maps by the Times, was created with the assistance of UCLAN journalism course leader Andy Dickinson, using Google Forms and Yahoo Pipes.

“The Times has a long history of commissioning opinion polls,” wrote Tom Whitwell, Communities Editor, Times Online, about the origin of the survey.

“These are scientifically rigorous, using a carefully selected panel of maybe 1,000 people. At Times Online, we can do things very differently. We can throw out questions to our readers and capture their mood quickly, cheaply and easily.

“It doesn’t have the statistical rigour of an opinion poll, but it’s a snapshot of unfiltered opinion and anecdotal. In the United States, many newspaper have taken the process further, using “crowd-sourcing” to research and write major news stories.”

Yahoo goes global with news mapping

Yahoo has combined its RSS feed of top news stories with a geo-encoding function of Yahoo Maps to create the Newsglobe (screenshot below). Fairly self-explanatory, it’s updated every few minutes and indicates the ranking of the news story by the size of the red bar plotting the story.

According to the developer’s blog, the globe could be adapted to show feeds of news by location or defined by specific search terms

yahoo-globe.jpg

Journalism.co.uk: Spokesman-Review uses interactive map to help readers in weather emergency

A US newspaper has added a new element to the coverage of local weather emergencies by developing a interactive map to assist affected readers.

The Spokesman-Review
, in Washington State, developed the Help Your Neighbors scheme to match readers’ offers of help with those needing assistance by plotting their locations on an interactive map.

The project was conceived as a quick response to sudden snow fall and effectively turned the paper into an extra emergency service, editor Steve Smith told Journalism.co.uk.

Read more… 

Huff Post launches interactive map of US campaign funding

The Huffington Post has launched a mash-up feature that details all contributions made to the US presidential campaigns on an interactive map.

The FundRace feature visually details how US cities, neighbourhoods and blocks are donating to different campaigns.

Image of Fundrace Map

It uses a searchable mash-up of data from Federal Election Commission on a Google Map, allowing users to search for the names, addresses and amounts pledged by all campaign contributors.

The tool allows users to take a birds-eye view of campaign funding or to drill down to specific neighbourhoods.

It follows a growing tradition of US news and opinion sites making use of freely available public information by taking raw data and displaying it visually on interactive maps. Chicagocrime.org was the first exponent of this visual approach to news when it started putting crime data on maps. It was quickly copied across the nation.

The trend has even spread across the Atlantic, although the impact in the UK will be more limited because the majority of public information is, somewhat perversely, not easily accessible by the public and has to be applied for under the Freedom of Information Act.

In addition to just mapping donations, the new Huffington Post feature also offers a widget for Facebook and a big donor feature highlighting which of the great and good of American life are stumping up cash for the campaigns.

Image of Fundrace donors