Tag Archives: #datajourn

#iweu: The web data revolution – a new future for journalism?

David McCandless, excited about data

Rounding off Internet Week Europe on Friday afternoon, the Guardian put on a panel discussion in its Scott Room on journalism and data: ‘The web data revolution – a new future for journalism’.

Taking part were Simon Rogers, David McCandless, Heather Brooke, Simon Jeffery and Richard Pope, with Dr Aleks Krotoski moderating.

McCandless, a leading designer and author of data visuals book Information is Beautiful, made three concise, important points about data visualisations:

  • They are relatively easy to process;
  • They can have a high and fast cognitive impact;
  • They often circulate widely online.

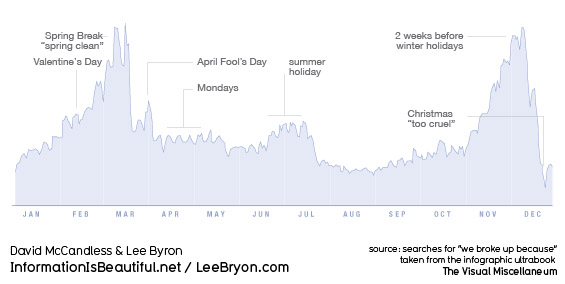
Large, unwieldy datasets share none of those traits, they are extremely difficult and slow to process and pretty unlikely to go viral. So, as McCandless’ various graphics showed – from a light-hearted graph charting when couples are most likely to break up to a powerful demonstration of the extent to which the US military budget dwarfs health and aid spending – visualisations are an excellent way to make information accessible and understandable. Not a new way, as the Guardian’s data blog editor Simon Rogers demonstrated with a graphically-assisted report by Florence Nightingale, but one that is proving more and more popular as a means to tell a story.

David McCandless: Peak break-up times, according to Facebook status updates

But, as one audience member pointed out, large datasets are vulnerable to very selective interpretation. As McCandless’ own analysis showed, there are several different ways to measure and compare the world’s armies, with dramatically different results. So, Aleks Krotoski asked the panel, how can we guard against confusion, or our own prejudices interfering, or, worse, wilful misrepresentation of the facts?

McCandless’ solution is three-pronged: firstly, he publishes drafts and works-in-progress; secondly, he keeps himself accountable by test-driving his latest visualisations on a 25-strong group he created from his strongest online critics; third, and most important, he publishes all the raw data behind his work using Google docs.

Access to raw data was the driving force behind Heather Brooke’s first foray into FOI requests and data, she told the Scott Room audience. Distressed at the time it took her local police force to respond to 999 calls, she began examining the stats in order to build up a better picture of response times. She said the discrepancy between the facts and the police claims emphasised the importance of access to government data.

Prior to the Afghanistan and Iraq war logs release that catapulted WikiLeaks into the headlines – and undoubtedly saw the Guardian data team come on in leaps and bounds – founder Julian Assange called for the publishing of all raw data alongside stories to be standard journalistic practice.

You can’t publish a paper on physics without the full experimental data and results, that should be the standard in journalism. You can’t do it in newspapers because there isn’t enough space, but now with the internet there is.

As Simon Rogers pointed out, the journalistic process can no longer afford to be about simply “chucking it out there” to “a grateful public”. There will inevitably be people out there able to bring greater expertise to bear on a particular dataset than you.

But, opening up access to vast swathes of data is one thing, and knowing how to interpret that data is another. In all likelihood, simple, accessible interfaces for organising and analysing data will become more and more commonplace. For the release of the 400,000-document Iraq war logs, OWNI.fr worked with the Bureau of Investigative Journalism to create a program to help people analyse the extraordinary amount of data available.

Simply knowing where to look and what to trust is perhaps the first problem for amateurs. Looking forward, Brooke suggested aggregating some data about data. For example, a resource that could tell people where to look for certain information, what data is relevant and up to date, how to interpret the numbers properly.

So does data – ‘the new oil’ – signal a “revolution” or a “new future” for journalism? I am inclined to agree with Brooke’s remark that data will become simply another tool in the journalists armoury, rather than reshape things entirely. As she said, nobody is talking about ‘telephone-assisted reporting’, completely new once upon a time, it’s just called reporting. Soon enough, the ‘computer-assisted reporting’ course she teaches now at City University will just be ‘reporting’ too.

See also:

Guardian information architect Martin Belam has a post up about the event on his blog, currybetdotnet

Digital journalist Sarah Booker liveblogged presentations by Heather Brooke, David McCandless and Simon Rogers.

Editor&Publisher: New AP regional investigative teams will boost CAR and data journalism

The Associated Press (AP) is creating four regional investigative teams to support its staff across the US with “reporting and presentation resources”, in particular by using journalists with expertise in computer-assisted reporting (CAR), Flash interactives and access to public records.

Now, any reporter in a region who has an idea for a story that requires high-level data analysis will have a partner. If an editor has an idea for a project that lends itself to an interactive map or another data-driven multimedia project, they can work with the team. When a big, breaking story happens anywhere in the country, we’ll tap the region’s I-team [the name given to the newly created teams] to begin digging into public records and inspection reports while the story is still developing, not days after the fact.

Full story at this link…

Hacks and Hackers play with data-driven news

Last Friday’s London-based Hacks and Hacker’s Day, run by ScraperWiki (a new data tool set to launch in beta soon), provided some excellent inspiration for journalists and developers alike.

In groups, the programmers and journalists paired up to combine journalistic and data knowledge, resulting in some innovative projects: a visualisation showing the average profile of Conservative candidates standing in safe seats for the General Election (the winning project); graphics showing the most common words used for each horoscope sign; and an attempt to tackle the various formats used by data.gov.uk.

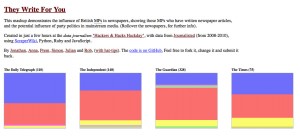
One of the projects, ‘They Write For You’ was an attempt to illustrate the political mix of articles by MPs for British newspapers and broadcasters. Using byline data combined with MP name data, the journalists and developers created this pretty mashup, which can be viewed at this link.

The team took the 2008-2010 data from Journalisted and used ScraperWiki, Python, Ruby and JavaScript to create the visualisation: each newspaper shows a byline breakdown by party. By hovering over a coloured box, users can see which MPs wrote for which newspaper over the same two year period.

The exact statistics, however, should be treated with some caution, as the information has not yet been cross-checked with other data sets.  It would appear, for example, that the Guardian newspaper published more stories by MPs than any other title, but this could be that Journalisted holds more information about the Guardian than its counterparts.

While this analysis is not yet ready to be transformed into a news story, it shows the potential for employing data skills to identify media and political trends.

David McCandless: Odds of dying from blogging?

It’s 35,000,000 to 1, according to set of graphics from InformationIsBeautiful.net (hat tip to @fionacullinan).

Screengrab of David McCandless infographic

While the blogging comparison might be slightly irreverent (and viewed alongside the very real threat to bloggers in countries with limited press freedom), Google is cited as the source for this stat and the whole set gives some interesting ideas for visualising data.

Full graphics at this link…

#DataJourn: Royal Mail cracks down on unofficial postcode database

A campaign to release UK postcode data that is currently the commercial preserve of the Royal Mail (prices at this link) has been gathering pace for a while. And not so long ago in July, someone uploaded a set to Wikileaks.

How useful was this, some wondered: the Guardian’s Charles Arthur, for example.

In an era of grassroots, crowd-sourced accountability journalism, this could be a powerful tool for journalists and online developers when creating geo-data based applications and investigations.

But the unofficial release made this a little hard to assess. After all, the data goes out of date very fast, so unless someone kept leaking it, it wouldn’t be all that helpful. Furthermore it would be in defiance of the Royal Mail’s copyright, so would be legally risky to use.

At the forefront of the ‘Free Our Postcodes’ campaign is Earnest Marples, the site named after the British postmaster general who introduced the postcode. Marples is otherwise known as Harry Metcalfe and Richard Pope, who – without disclosing their source – opened an API which could power sites such as PlanningAlerts.com and Jobcentre Pro Plus.

“We’re doing the same as everyone’s being doing for years, but just being open about it,” they said at the time of launch earlier this year.

But now they have closed the service. Last week they received cease and desist letters from the Royal Mail demanding that they stop publishing information from the database (see letters on their blog).

“We are not in a position to mount an effective legal challenge against the Royal Mail’s demands and therefore have closed the ErnestMarples.com API, effective immediately,” Harry Metcalfe told Journalism.co.uk.

“We’re very disappointed that Royal Mail have chosen to take this course. The service was supporting numerous socially useful applications such as Healthwhere, JobcentreProPlus.com and PlanningAlerts.com. We very much hope that the Royal Mail will work with us to find a solution that allows us to continue to operate.”

A Royal Mail spokesman said: “We have not asked anyone to close down a website. We have simply asked a third party to stop allowing unauthorised access to Royal Mail data, in contravention of our intellectual property rights.”

Signals intelligence journalism: using public information websites to source stories

Useful information is more widely and easily available than ever and the increasing amount of online data released by the government and others can help improve the originality of journalists’ work.

Look to VentnorBlog – the hyperlocal online effort based in the Isle of Wight which Journalism.co.uk commended during the Vestas protest coverage – for some inspiration.

[For those unfamiliar with the story, locals had been protesting against the closure of the wind turbine factory in front of national, local and hyperlocal media. Despite a long and well-publicised campaign in August 2009, Danish company Vestas has now pulled out of manufacturing on the Isle of Wight but protests and attacks by critics in the press continue. A national day of action to support redundant Vestas workers has been planned for Thursday, September 17.]

Last week, using the Area Ship Traffic Website, AIS, VB was able to report where two barges held by an agent – NEG  Micron Rotors – who used to own the Vestas’ factory were due to head. They would be used to move the blades from the factory, which are so huge that they can only travel away on the water on special vessels.

The correspondent who tipped off VentnorBlog knew that the wind turbine blades can only be transferred from the riverside to barge when it is high tide and across a public footpath so, using the information on the AIS site, concluded that the barges would be moved in a specific time slot.

As a result Vestas protesters asked supporters to join them at the Marine Gate on the River Medina. Of course VentnorBlog got down there to take some pictures.

Now let’s take that one step further: how can journalists tap into this kind of publicly available data to scoop stories?

Tony Hirst, Open University academic, Isle of Wight resident and prolific data masher, shared some thoughts with Journalism.co.uk. He said that we should look to signals intelligence for further inspiration: the interception and analysis of ‘signals’ emitted by whoever you are surveying. As military historians would be the first to tell you, they can be a very rich source of intelligence about others’ actions and intentions, he explained.

“A major component of SIGINT is COMINT, or Communications Intelligence, which focuses on the communications between parties of interest. Even if communications are encrypted, Traffic Analysis, or the study of who’s talking to whom, how frequently, at what time of day, or  – historically – in advance of what sort of action, can be used to learn about the intentions of others.”

And this is relevant to journalists, he added:

“For starters, data is information, or raw intelligence. The job of the analyst, or the data journalist, is to identify signals in that information in order to identify something of meaning – ‘intelligence’ about intentions, or ‘evidence’ for a particular storyline.

The VentnorBlog story, he said, describes how a ‘sharp-eyed follower of movements at the plant’ knew where two barges were headed and at what time – valuable journalistic information:

“Amid the mess of Solent shipping information was a meaningful signal relating to the Vestas story – the movement of the barge that takes wind turbine blades from the Vestas factory on the Isle of Wight to the mainland.”

Do you have suggestions for sources of ‘signals intelligence’ journalism? Or examples of where it has been done well?

ReadWriteWeb: Journalism needs data

As Zach Beauvais points out in his post for the ReadWriteWeb, it’s not new that facts are crucial to journalism.

“But as we move further into the 21st century, we will have to increasingly rely on ‘data’ to feed our stories, to the point that ‘data-driven reporting’ becomes second nature to journalists.”

“The shift from facts to data is subtle and makes perfect sense. You could that say data are facts, with the difference that they can be computed, analyzed, and made use of in a more abstract way, especially by a computer.”

Full post at this link…

Journalism.co.uk is extremely interested in the #datajourn discussion.

Computer-assisted reporting is also nothing new, the use of data in journalism is not particularly radical, but new developments in technology, mindset, and accessibility mean that data-sets will have a new place in the profession.

Join the conversation and please get in touch with your thoughts: judith@journalism.co.uk.

#datajourn: Simon Willison’s ‘hack day’ tools for non-developers

The Guardian’s second (internal) hack day is imminent; the development team, members of the tech department and even journalists get together to play and build.

Read about the first one here. Remember this effort by guest hacker, Matthew Somerville: http://charlian.dracos.co.uk/?

In preparation for the second, Simon Willison (@simonw), the lead developer behind the Guardian’s MPs’ expenses crowdsourcing application, has helpfully put together an (external) list of tools for non-developers: “sites, services and software that could be used for hacking without programming knowledge as a pre-requisite. ”

Full list at this link…

Nieman Journalism Lab: Four crowdsourcing lessons from the Guardian’s expenses experiment

A great post from the Nieman Journalism Lab, offering a US perspective on the Guardian’s feat with expenses data. The title says it all really: ‘Four crowdsourcing lessons from the Guardian’s (spectacular) expenses-scandal experiment’.

Full post at this link…