Category Archives: Investigative journalism

Daily Mirror publisher faces ‘three to four’ phone-hacking cases, says lawyer

Announcing the launch of an internal review of editorial controls and practices last week, Trinity Mirror, publisher of the Daily Mirror, was keen to stress that the review was not connected to recent phone-hacking allegations levelled against its tabloid.

The publisher issued a statement in response to the claims that the Mirror was implicated in the use of the so-called dark arts, calling them “totally unsubstantiated”.

But allegations concerning the paper have since mounted. Lawyer Mark Lewis, who has represented a number of celebrities in phone-hacking suits against News International, said in yesterday’s Sunday Times that the Mirror is facing “about three or four cases which will start within the next few weeks”.

Another report, in the Independent on Sunday, claims that “top investors” in Trinity Mirror, undoubtedly concerned by the steep share-price drop the company saw last week, “want to know more” and have quizzed chief executive Sly Bailey.

Former Daily Mirror editor Piers Morgan, who was fired by Bailey in 2004, has come under scrutiny as the spotlight shifts from News International to Trinity Mirror, although he denies any knowledge of criminality at the Mirror during his time there. Conservative MP Louise Mensch was forced to apologise to Morgan in parliament last week, after incorrectly stating he had admitted being aware of phone hacking at the tabloid.

Citing evidence collected by the Information Commissioner’s Operation Motorman report, blogger Guido Fawkes has alleged that Morgan signed off on £442,000-worth of invoices submitted to the paper by a private detective. It is important to note, however, that the use of a private detective does not necessarily involve any criminality.

According to a report in yesterday’s (31 July) Sunday Telegraph, Trinity Mirror is planning to increase its cost-cutting target for the year from £15 million to £25 million, triggering further job losses.

The company is due to publish its annual financial results on 11 August.

Greenslade: Phone hacking book deals already signed

The Guardian’s Roy Greenslade reports today that book deals relating to the phone-hacking scandal have already been signed.

This includes one for Guardian journalist Nick Davies, of which is said to be “provisionally” titled Hack Attack.

It’s scheduled for release in autumn next year. So it looks as though Labour MP Tom Watson will get in first because his tome, for Penguin Press, is due to be published before the end of this year. It is being co-written with Martin Hickman of the Independent, a former journalist of the year.

Greenslade adds that “there is not the least sense of competition or animosity between Davies and Watson”, with the story big enough for the two of them, if not more.

Former Panorama reporter calls for ‘searching inquiry’ into Primark documentary

In an opinion piece in the Independent yesterday former chief correspondent of Panorama Tom Mangold called on the BBC to conduct a “searching inquiry into why its system of firewalls broke down”, in reference to last week’s finding of the BBC Trust’s editorial standards committee that certain footage within a Panorama documentary was “more likely that not”, not genuine.

The BBC was ordered to make an on-air apology after a Panorama documentary about retail outlet Primark was found to have breached editorial guidelines on accuracy and fairness. The ESC said it had examined a “substantial body of evidence”, including rushes tapes, emails to the programme team from the freelance journalist who obtained the footage and witness evidence, in relation to a specific piece of footage which appeared in the film.

Although it admitted it was not able to say beyond reasonable doubt, the committee concluded that it was more likely than not that the footage was not genuine.

Writing in the Independent Mangold claimed the delay in this admission has caused “an editorial catastrophe”.

It is only now, three years after the programme was broadcast, that the BBC Trust has forced Panorama to admit the error of its ways. In the meantime, the BBC’s arrogant refusal to admit it was wrong has resulted in an editorial catastrophe not only for Panorama, the flagship, but for all the corporation’s journalism.

I joined Panorama from Fleet Street, where none of us had entirely clean hands. We coloured our stories as much as we could and thought nothing of doing things our editors never wanted to hear about. But, whatever we did, we never lied, deceived or made stories up. It was the short cut to the dole. And if a story wasn’t good enough or couldn’t be made to work – then there was always another round the corner. I know what it means to have to deliver with a tiny budget, but I also know when to give up.

Read more here…

Related:

Panorama documentary found in serious breach of accuracy and fairness rules

OWNI.eu publishes WikiLeaks ebook

The rush to get books in the shops in the wake of the WikiLeaks phenomenon was quite predictable. It’s a story with all the Hollywood mores, but strangely real. The films are soon to follow.

So far we’ve had, most notably, David Leigh’s and Luke Harding’s “WikiLeaks: Inside Julian Assange’s War on Secrecy” and Daniel Domscheit Berg’s “Inside WikiLeaks”.

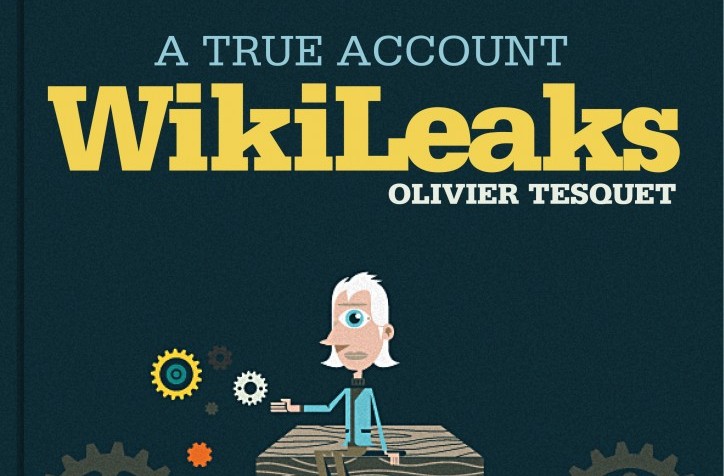
Now Paris-based OWNI.eu, which helped build apps for WikiLeaks to allow people to navigate the Iraq war logs and US embassy cables, is publishing Olivier Tesquet’s “WikiLeaks: A True Account” through its own publisher OWNI Books. The organisation boasts an “exceptional vantage point” on the whistleblowing group, and claims that Tesquet’s “thorough investigation” will shed light in the relationship between the WikiLeaks and OWNI.

OWNI Books publishes ebooks only, and this latest one will be the first published in three languages: French, English and Arabic.

Hot on the heels of the OWNI book – and the other behind-the-scenes accounts – will be a more academic take on the affair from Polis director Charlie Beckett and former WikiLeaks journalist James Ball.

The book was announced by Beckett at the Polis Value of Journalism conference on Friday and is expected within the next few months.

Release of printed Palin emails set to kick off race for stories

The world’s media (well, some of it at least) is eagerly anticipating the release of tens of thousands of emails sent by Sarah Palin while she was governor of Alaska.

The emails, which date from her inauguration as governor in 2006 through to her selection as John McCain’s running mate for the 2008 Republican presidential campaign, will be released at 6pm today.

The release looks set to spark a race between news organisations to dig out stories (or, let’s face it, plain old gossip).

In an affront to everything modern and digital, Palin’s office will release the 24,199 emails in printed form, in six boxes. That means, of course, that journalists will have to visit the courthouse in Juneau, Alaska to collect the documents and trawl through them on paper or scan them in.

The major US nationals will be on the courthouse steps at the appointed time of course. But it looks like there will be at least one UK newspaper represented – with the Guardian’s “crack correspondents” Ewen MacAskill and Ed Pilkington due to be “holed up in a Juneau hotel room combing through thousands of Palin emails as fast as they can read”.

The Guardian will then follow its MPs expenses app model by putting the trove of documents online and asking its readers to help analyse them.

The release comes just ahead of Palin’s visit to the UK and follows her recent bus tour of the east coast of the US. She is currently refusing to be drawn on whether she intends to run for president, and it remains to be seen whether the release of these emails will shed some light on a potential bid, derail it, or reveal no new interesting information at all.

Palin’s email was hacked back in 2008, with Anonymous, the group behind pro-WikiLeaks attacks on Mastercard and Amazon, thought to be responsible.

#newsrw: Heather Brooke – ‘How do any journalists in the UK do their job?’

The main difficulty for data journalist in the UK is gaining access to meaningful data, Heather Brooke said in her keynote speech at news:rewired – noise to signal.

Brooke, a journalist, author and freedom-of-information campaigner, who is best known for her role in bringing the MPs expenses to light and who went on to work with the Guardian on the WikiLeaks cables, compared the difficulty in accessing data in the UK compared with the US, where she trained and worked as a political journalist and a crime reporter.

When working in the US, Brook explained how she was “heavily reliant on public records” and said the “underpinning of my journalism was state records”. As a crime reporter she used a police scanner, likening it to those familiar with US series ‘The Wire’.

“As a journalist I would decide what the story was,” she said, based on the data from public records. She was able to note patterns in the incident reports and able to notice a spate in domestic violence, for example.

Brooke told of how many UK police forces limit the release of their data to media messages left on a voice bank.

Public bodies in the UK “control the data, they control the public perception of the story,” she said.

“How do any journalists in the UK do their job?” she asked. And it was that problematic question that led her to becoming an FOI campaigner.

When she asked for receipts for US politicians’ expense claims in the States, she had them within a couple of days.

It was a different story in the UK. It took her five years and several court cases, including taking the case to the High Court which led to the release of second home allowance for 10 MPs.

The House of Commons “sticking their feet on the ground” refused to release further data, which had been scanned in by the fees office.

A CD of the data which was touted round Fleet Street and sold for £110,000.

The Telegraph, rather than Brooke, then had the data and had to verify and cross check it.

What is purpose as journalists in the digital age?

Brooke’s answer to that question is that “we need to change an unhelpful attitude” of public records being withheld.

“The information exists as if they own it”, she said.

“They don’t want negative information to come out” and they want to try and manage their reputation, she said in what she described as “the take over of public relations”.

“We need to be campaigning for these sets of data” and gave the examples of courts and the release of files.

“We make the FOI request and that should open the whole tranche of data so any other journalist can go back and use it for their reporting.”

She said data journalism is “not just about learning how to use Excel spreadsheets but you have to have something to put in those spreadsheets”.

Brooke made a “rallying cry” as to why professional journalists, particularly those who practice investigative journalism, are vital.

The “one unique selling point, why people would come to a professional news organisation” is the training and experience journalists have in “sifting through for what is important and what is true”.

Brooke said as people have more and more information, a journalist’s role is distilling and signposting the information.

The second key point she made is journalists must establish “what is true”.

When a politician claims that crime has gone down, a journalist must be able to verify it and “test the truthfulness” of it, she said.

She explained that journalists need to know how that data was collected and, ideally, have access the data itself.

Brooke told how she tried to pitch stories on MPs expenses on an almost daily basis before they came to light. She said editors thought it was a non-story and “almost took the word of parliament” and had the perception that the public was not interested. But they were.

“It’s a symptom of the public not having meaningful information and are not able to take action. That’s our role as professional journalists.”

This article is a cross post. It was originally published on news:rewired.
Data Miner: Liberating Cabinet Office spending data

The excellent Nicola Hughes, author of the Data Miner UK blog, has a very practical post up about how she scraped and cleaned up some very messy Cabinet Office spending data.

Firstly, I scraped this page to pull out all the CSV files and put all the data in the ScraperWiki datastore. The scraper can be found here.

It has over 1,200 lines of code but don’t worry, I did very little of the work myself! Spending data is very messy with trailing spaces, inconsistent capitals and various phenotypes. So I scraped the raw data which you can find in the “swdata” tab. I downloaded this and plugged it into Google Refine.

And so on. Hughes has held off on describing “something interesting” that she has already found, focusing instead on the technical aspects of the process, but she has published her results for others to dig into.

Before I can advocate using, developing and refining the tools needed for data journalism I need journalists (and anyone interested) to actually look at data. So before I say anything of what I’ve found, here are my materials plus the process I used to get them. Just let me know what you find and please publish it!

See the full post on Data Miner UK at this link.

Nicola will be speaking at Journalism.co.uk’s news:rewired conference next week, where data journalism experts will cover sourcing, scraping and cleaning data along with developing it into a story.

NPR: Finding stories in a ‘sea of government data’

At the end of last week, NPR’s On The Media show spoke to Texas Tribune reporter Matt Stiles and Duke University computational journalism professor Sarah Cohen about how to find good stories in a “sea of government data”.

Listen to the full interview below:

Journalism.co.uk will be looking at open government data and the skills needed to find stories in datasets at its upcoming news:rewired conference. See the full agenda at this link.

New tool provides optional upload of iPhone location data

The Research and Development Group at the New York Times Company has released a tool to allow iPhone users to upload their location data. The information – which is anonymous – will then be available to groups who apply to access the data.

Explanations here and here on the openpaths.cc website state:

This data represents a unique opportunity to help solve some of the world’s toughest problems. We believe you should have the option of donating your data in an open, secure fashion, while maintaining control of your information and where it goes.

Research requests are received from any and all projects – public, private, commercial, academic, artistic, or governmental. Requests typically look at specific geographical areas or demographic information about their subjects, so research requests include these criteria. Based on this information, users receive monthly updates that list the projects where their data is a good fit, and are offered the opportunity to donate their data.

In return, we ask researchers to provide a small benefit to their data donors. This might be a custom visualization of a donor’s location information, access to the results of the research, or other related benefits.

When researchers revealed that iPhones had been recording location data, concerns were raised about privacy.

As explained in this article in the Guardian:

Security researchers discovered that Apple‘s iPhone keeps track of where you go – and saves every detail of it to a secret file on the device which is then copied to the owner’s computer when the two are synchronised.

The file contains the latitude and longitude of the phone’s recorded coordinates along with a timestamp, meaning that anyone who stole the phone or the computer could discover details about the owner’s movements using a simple program.

For some phones, there could be almost a year’s worth of data stored, as the recording of data seems to have started with Apple’s iOS 4 update to the phone’s operating system, released in June 2010.

Apple has now released a software update 4.3.3 to fix this. Anyone who wants to make their data available should hold off installing it.

#ijf11: Lessons in data journalism from the New York Times

Follow this link or scroll to the bottom to start by hearing more from New York Times graphics editor Matthew Ericson on what kind of people make up his team and how they go about working on a story

The New York Times has one of the largest, most advanced graphics teams of any national newspaper in the world. Yesterday at the International Journalism Festival, NYT deputy graphics editor Matthew Ericson led an in-depth two-hour workshop on his team’s approach to visualising some of the data that flows through the paper’s stories every day.

He broke the team’s strategy down in to a few key objectives, the four main ones being:

Provide context

Describe processes

Reveal patterns

Explain the geography

Here is some of what Ericson told the audience and some of the examples he gave during the session, broken down under the different headers.

Provide context

Graphics should bring something new to the story, not just repeat the information in the lede.

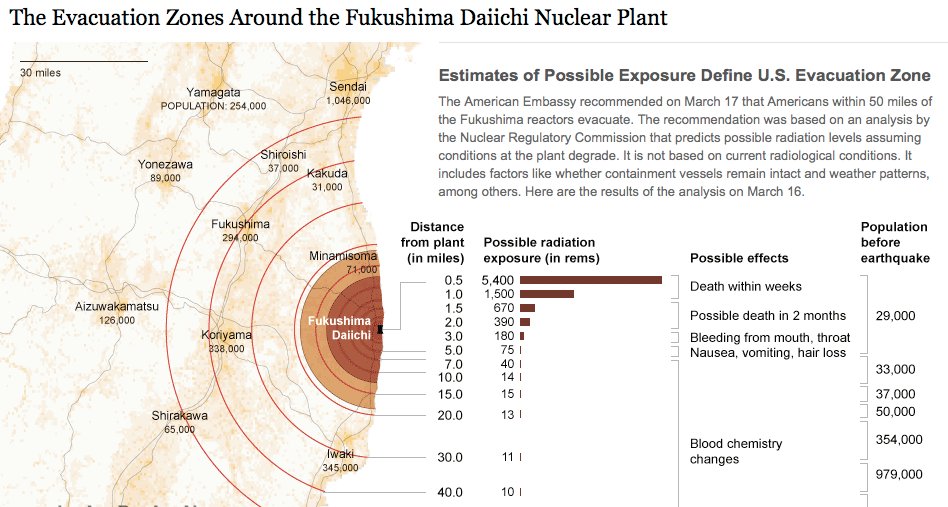
Ericson emphasised a graphics team that simply illustrates what the reporter has already told the audience is not doing its job properly. “A graphic can bring together a variety of stories and provide context,” he said, citing his team’s work on the Fukushima nuclear crisis.

We would have reporters with information about the health risks, and some who were working on radiation levels, and then population, and we can bring these things together with graphics and show the context.

Describe processes

The Fukushima nuclear crisis has spurned a lot of graphics work at news organisations across thew world, and Ericson showed a few different examples of work on the situation to the #ijf11 audience. Another graphic demonstrated the process of a nuclear meltdown, and what exactly was happening at the Fukushima plant.

As we approach stories, we are not interested in a graphic showing how a standard nuclear reactor works, we want to show what is particular to a situation and what will help a reader understand this particular new story.

Like saying: “You’ve been reading about these fuel rods all over the news, this is what they actually look like and how they work”.

From nuclear meltdown to dancing. A very different graphic under the ‘desribe processes’ umbrella neatly demonstrated that graphics work is not just for mapping and data.

Disecting a Dance broke down a signature piece by US choreographer Merce Cunningham in order to explain his style.

The NYT dance critic narrated the video, over which simple outlines were overlaid at stages to demonstrate what he was saying. See the full video at this link.

Reveal patterns

This is perhaps the objective most associated with data visualisation, taking a dataset and revealing the patterns that may tell us a story: crime is going up here, population density down there, immigration changing over time, etc.

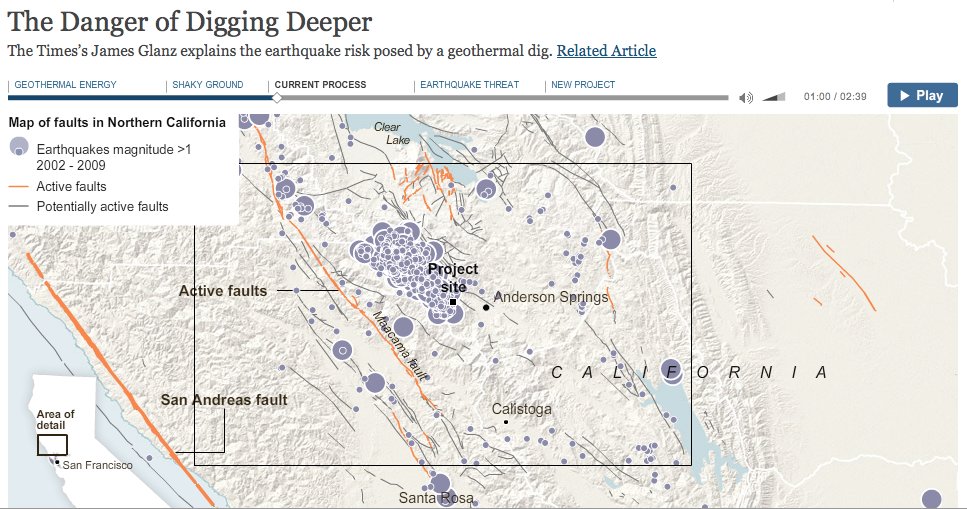
Ericson showed some of the NYT’s work on voting and immigration patterns, but more interesting was a “narrative graphic” that charted the geothermal changes in the bedrock under California created by attempts to exploit energy in hot areas of rock, which can cause earthquakes.

These so-called narrative graphics are take what we think of as visualisation close to what we have been seeing for a while in broadcast news bulletins.

Explain geography

The final main objective was to show the audience the geographical element of stories.

Examples for this section included mapping the flooding of New Orleans following hurricane Katrina, including showing what parts of the region were below sea level and overlaying population density, showing where levies had broken and showing what parts of the land were underwater.

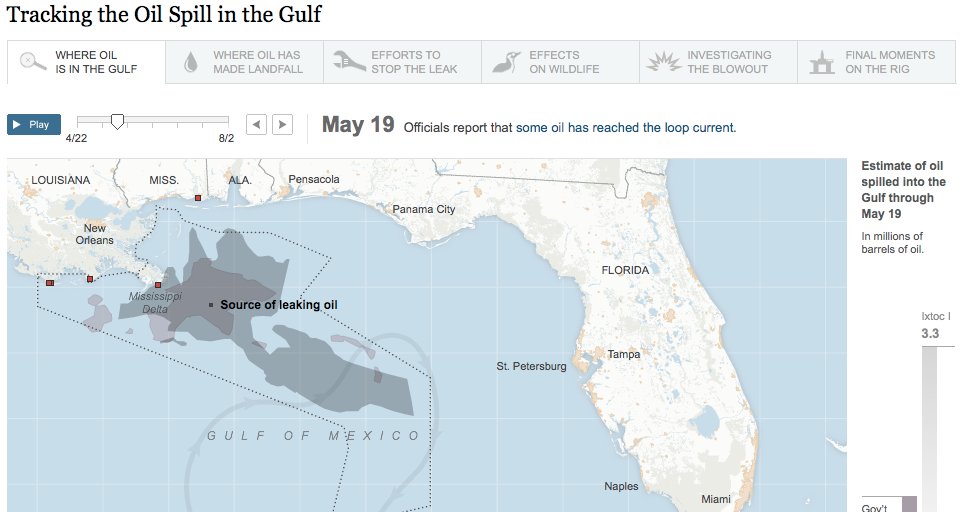
Geography was also a feature of demonstrating the size and position of the oil slick in the Gulf following the BP Deepwater Horizon accident, and comparing it with previous major oil spills.

Some of the tools in use by the NYT team, with examples:


Google Fusion Tables
Tableau Public: Power Hitters
Google Charts from New York State Test Scores – The New York Times
HTML, CSS and Javascript: 2010 World Cup Rankings
jQuery: The Write Less, Do More, JavaScript Library
jQuery UI – Home
Protovis
Raphaël—JavaScript Library
The R Project for Statistical Computing
Processing.org

An important formula 

Data + story > data

It doesn’t take a skilled mathematician to work that one out. But don’t be fooled by it’s simplicity, it underpinned a key message to take away from the workshop. The message is equally simple: graphics and data teams have the skill to make sense of data for their audience, and throwing a ton of data online without adding analysis and extracting a story is not the right way to go about it.

More from Matthew Ericson on the NYT graphics team

I spoke to Ericson after the session about what kind of people make up his team (it includes cartographers!) and how they go about working on a story.

Here’s what he had to say:

Listen!

The BBC’s Peter Horrocks on data journalism

I spoke to Peter Horrocks, who is director of the BBC World Service and the BBC’s global online news operations after the session about his take on data journalism and whether the BBC Global News had ambitions in this direction.

Here’s what he had to say:

Listen!

See the full list of links for Ericson’s session on his blog.

See more from #ijf11 on the Journalism.co.uk Editor’s Blog.